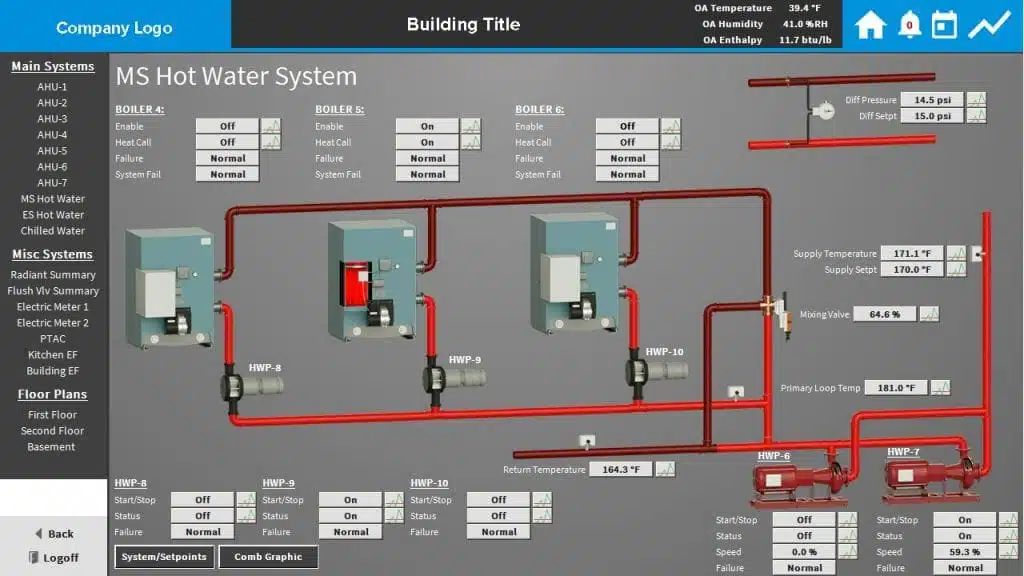
Innovative BAS graphics crafted by our exceptional in-house designers.
Our talented mix of creative and technical staff offers BAS graphics services, 3D design and animation, video production, and much more.
OUR SERVICES

Our interactive design team can create an exceptional user experience no matter what your needs.

Promote your business and capture your audience’s attention with a visual message that brings your vision to life.

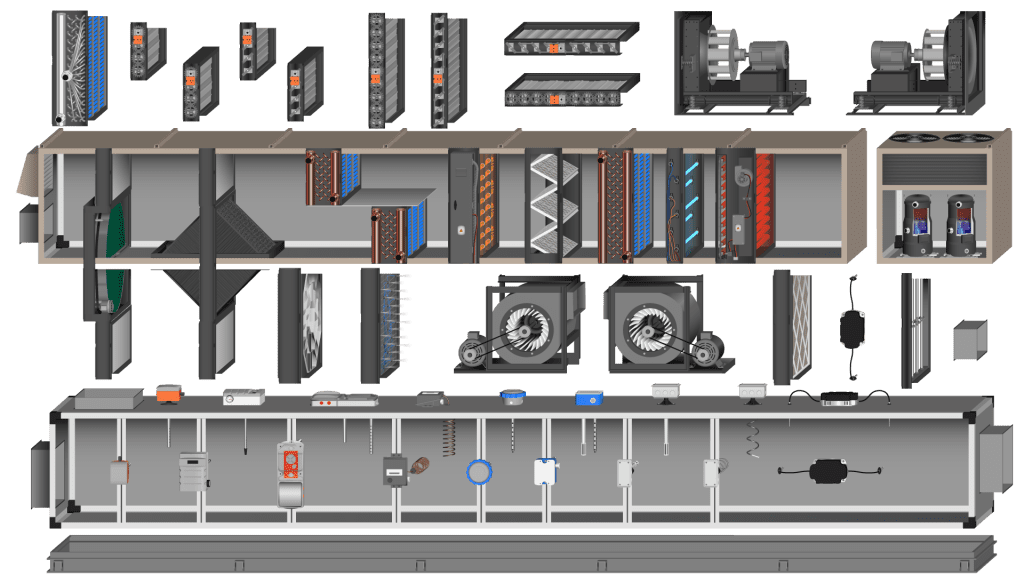
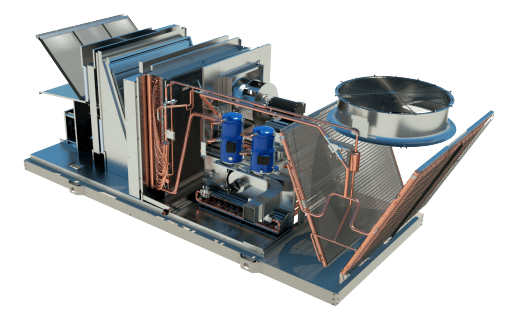
Bring your building to life with custom 2D or 3D floor plans, site maps, 3D rendering and virtual tours.

We can help bring your custom ideas to reality with our team of highly skilled BAS Graphic Specialists.

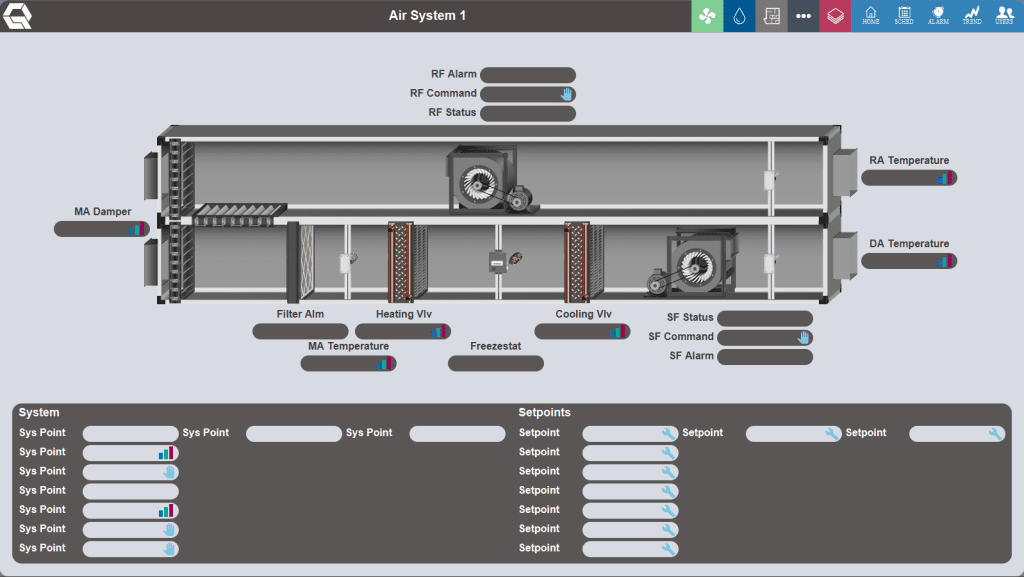
INDUSTRY-LEADING BAS GRAPHIC SERVICES
BAS SERVICES
Our graphics team consists of mechanical engineers, architects, drafters and others to prove comprehensive solutions for the building controls industry. We’ve completed custom HVAC symbol libraries for most of the industry’s largest control companies’ buildings automation software. We’ve worked with Johnson Controls, Inc., Trane, Tridium, KMCControls, Siemens Building Technologies, Iconics and others.
Slide Your Mouse Over.
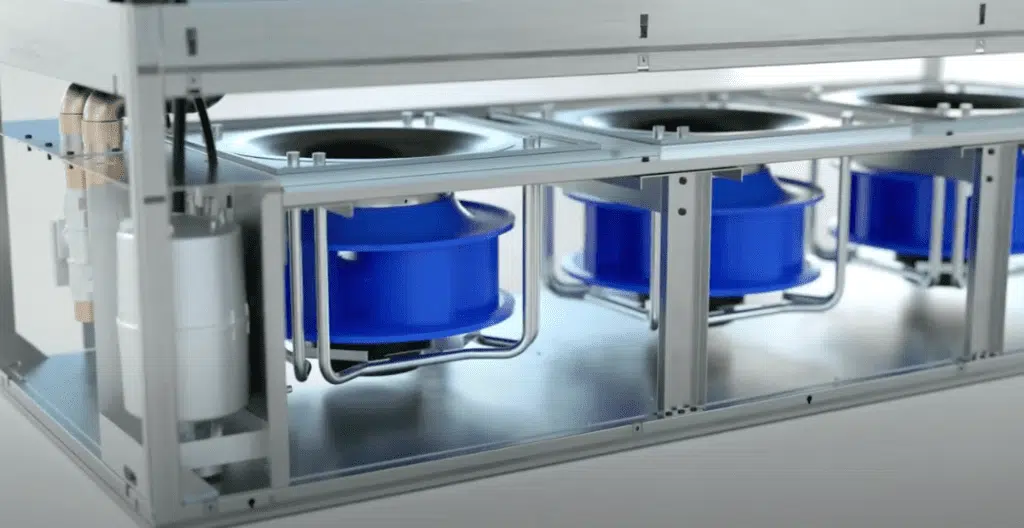
3D MOTION GRAPHICS & ANIMATION
Stand out from the crowd — QA Graphics’ custom 3D animation and motion graphic services will set you apart from the competition.
OUR CUSTOMERS