QAGSiteMap
QAGSiteMap brings your entire facility portfolio to life on an interactive map — right inside Niagara 4. Monitor real-time conditions, track alarms, and navigate to any building with a single click. No external tools. No extra licenses for mapping APIs. This will be sold as a one-time purchase with a legal agreement.
Key Features
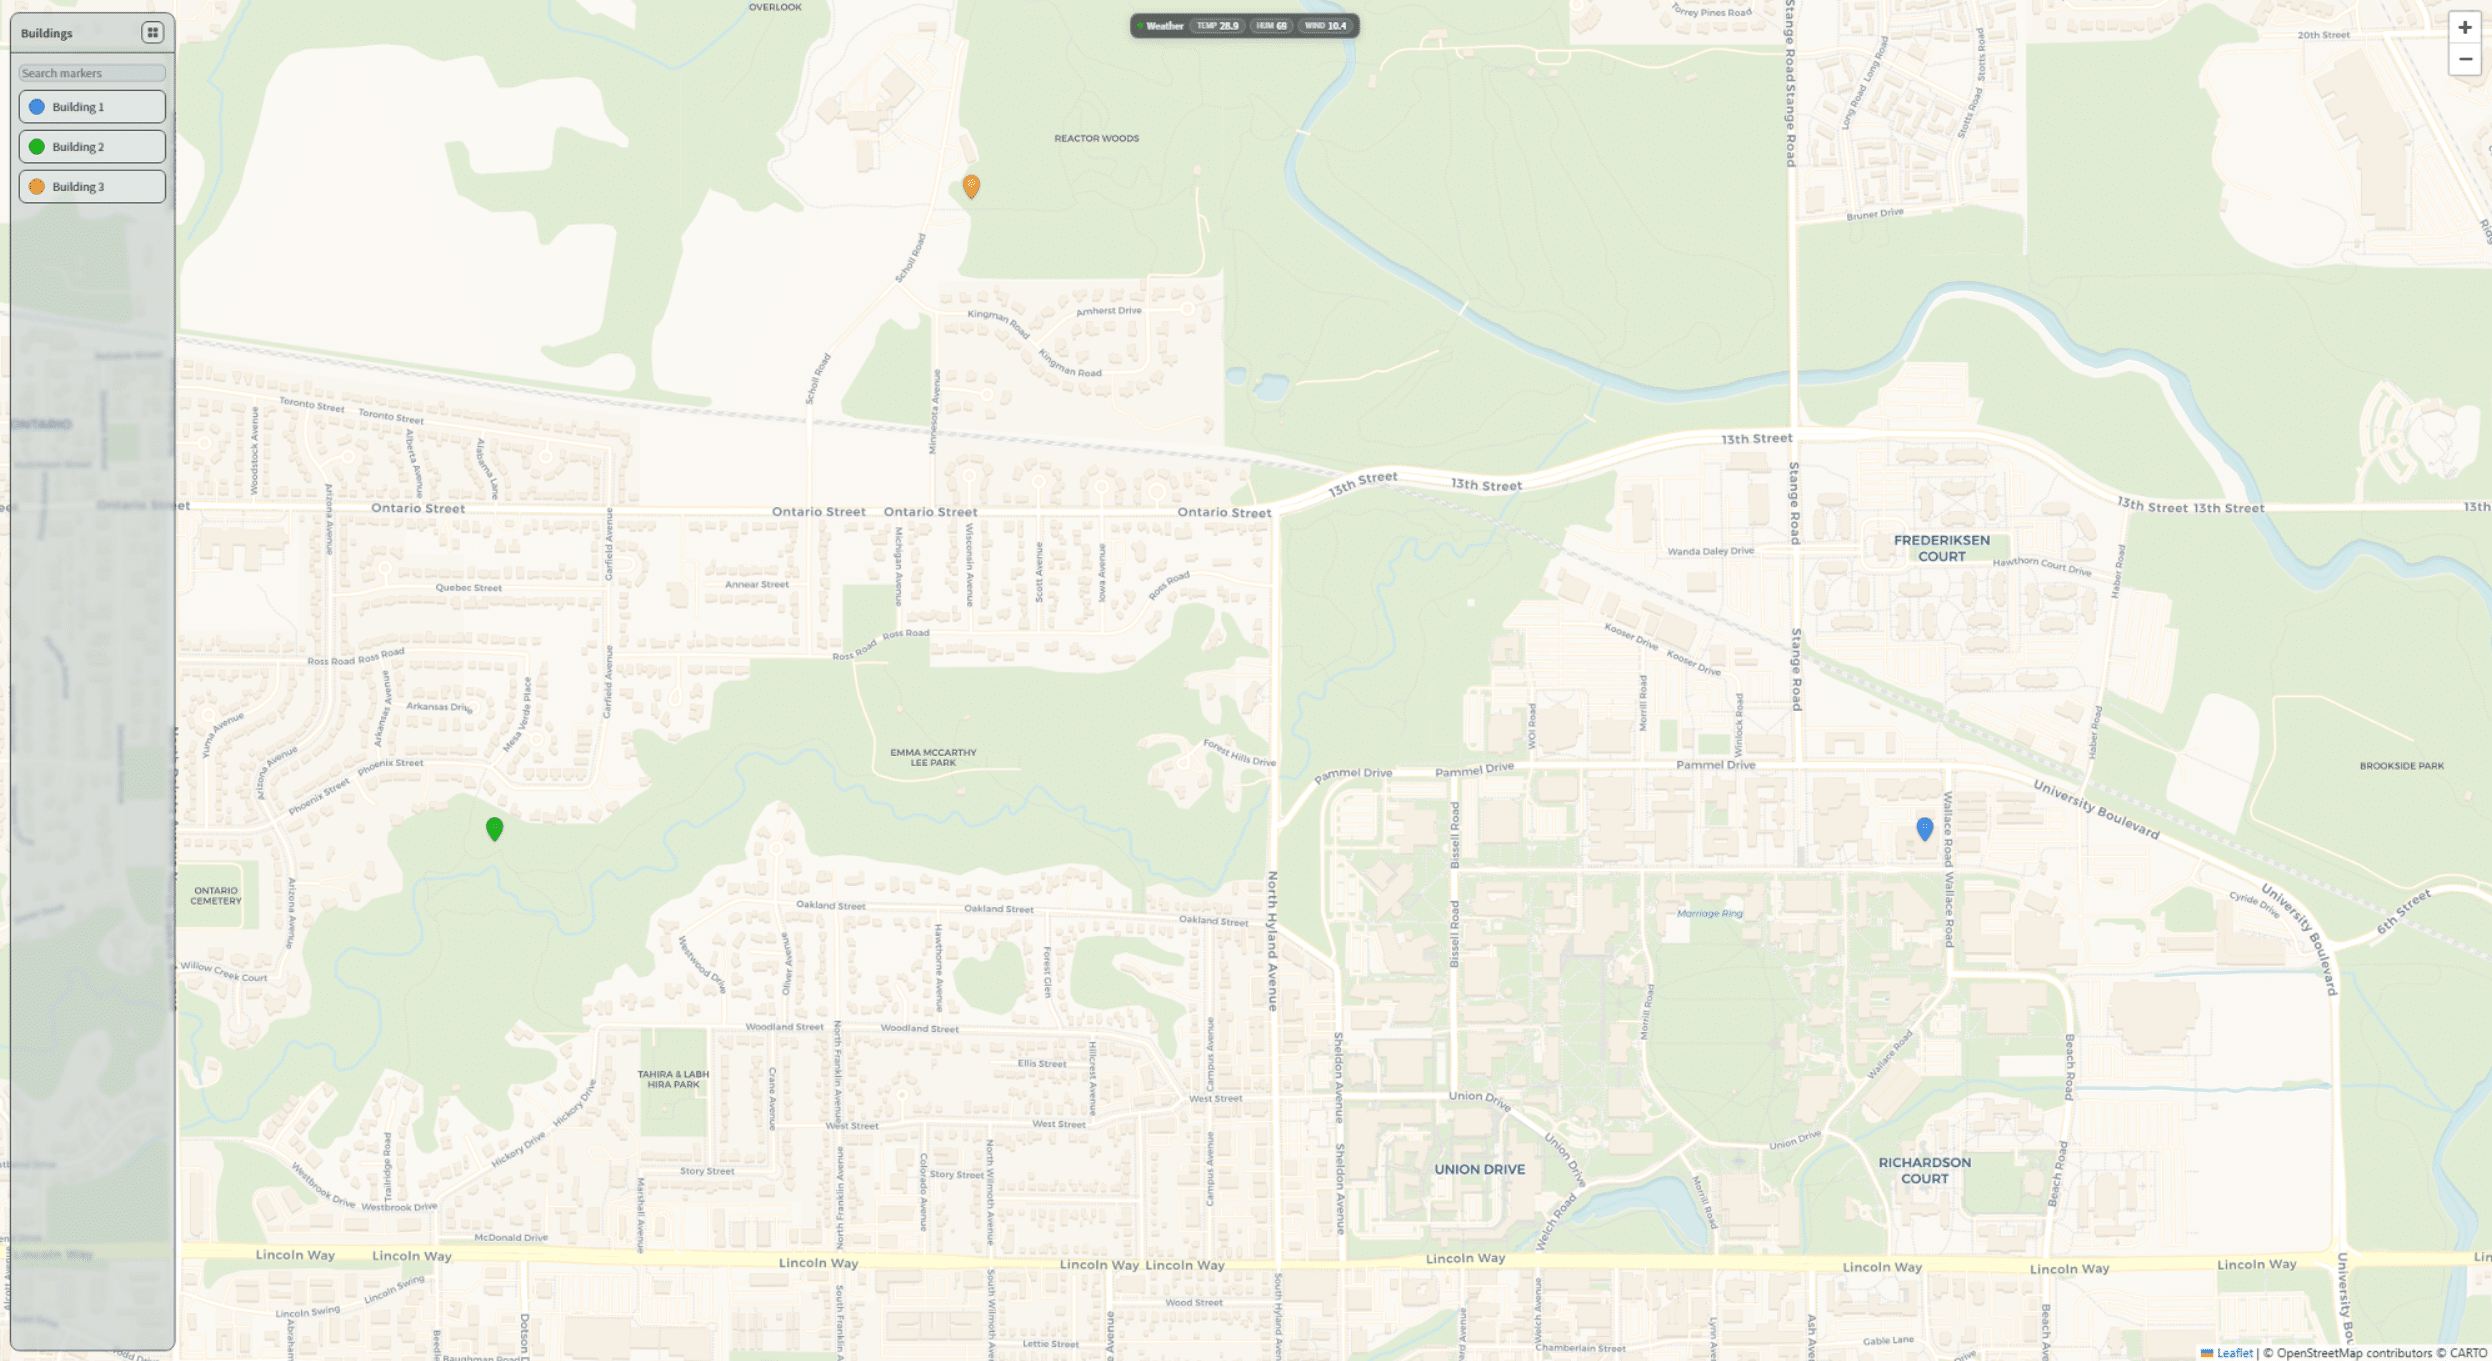
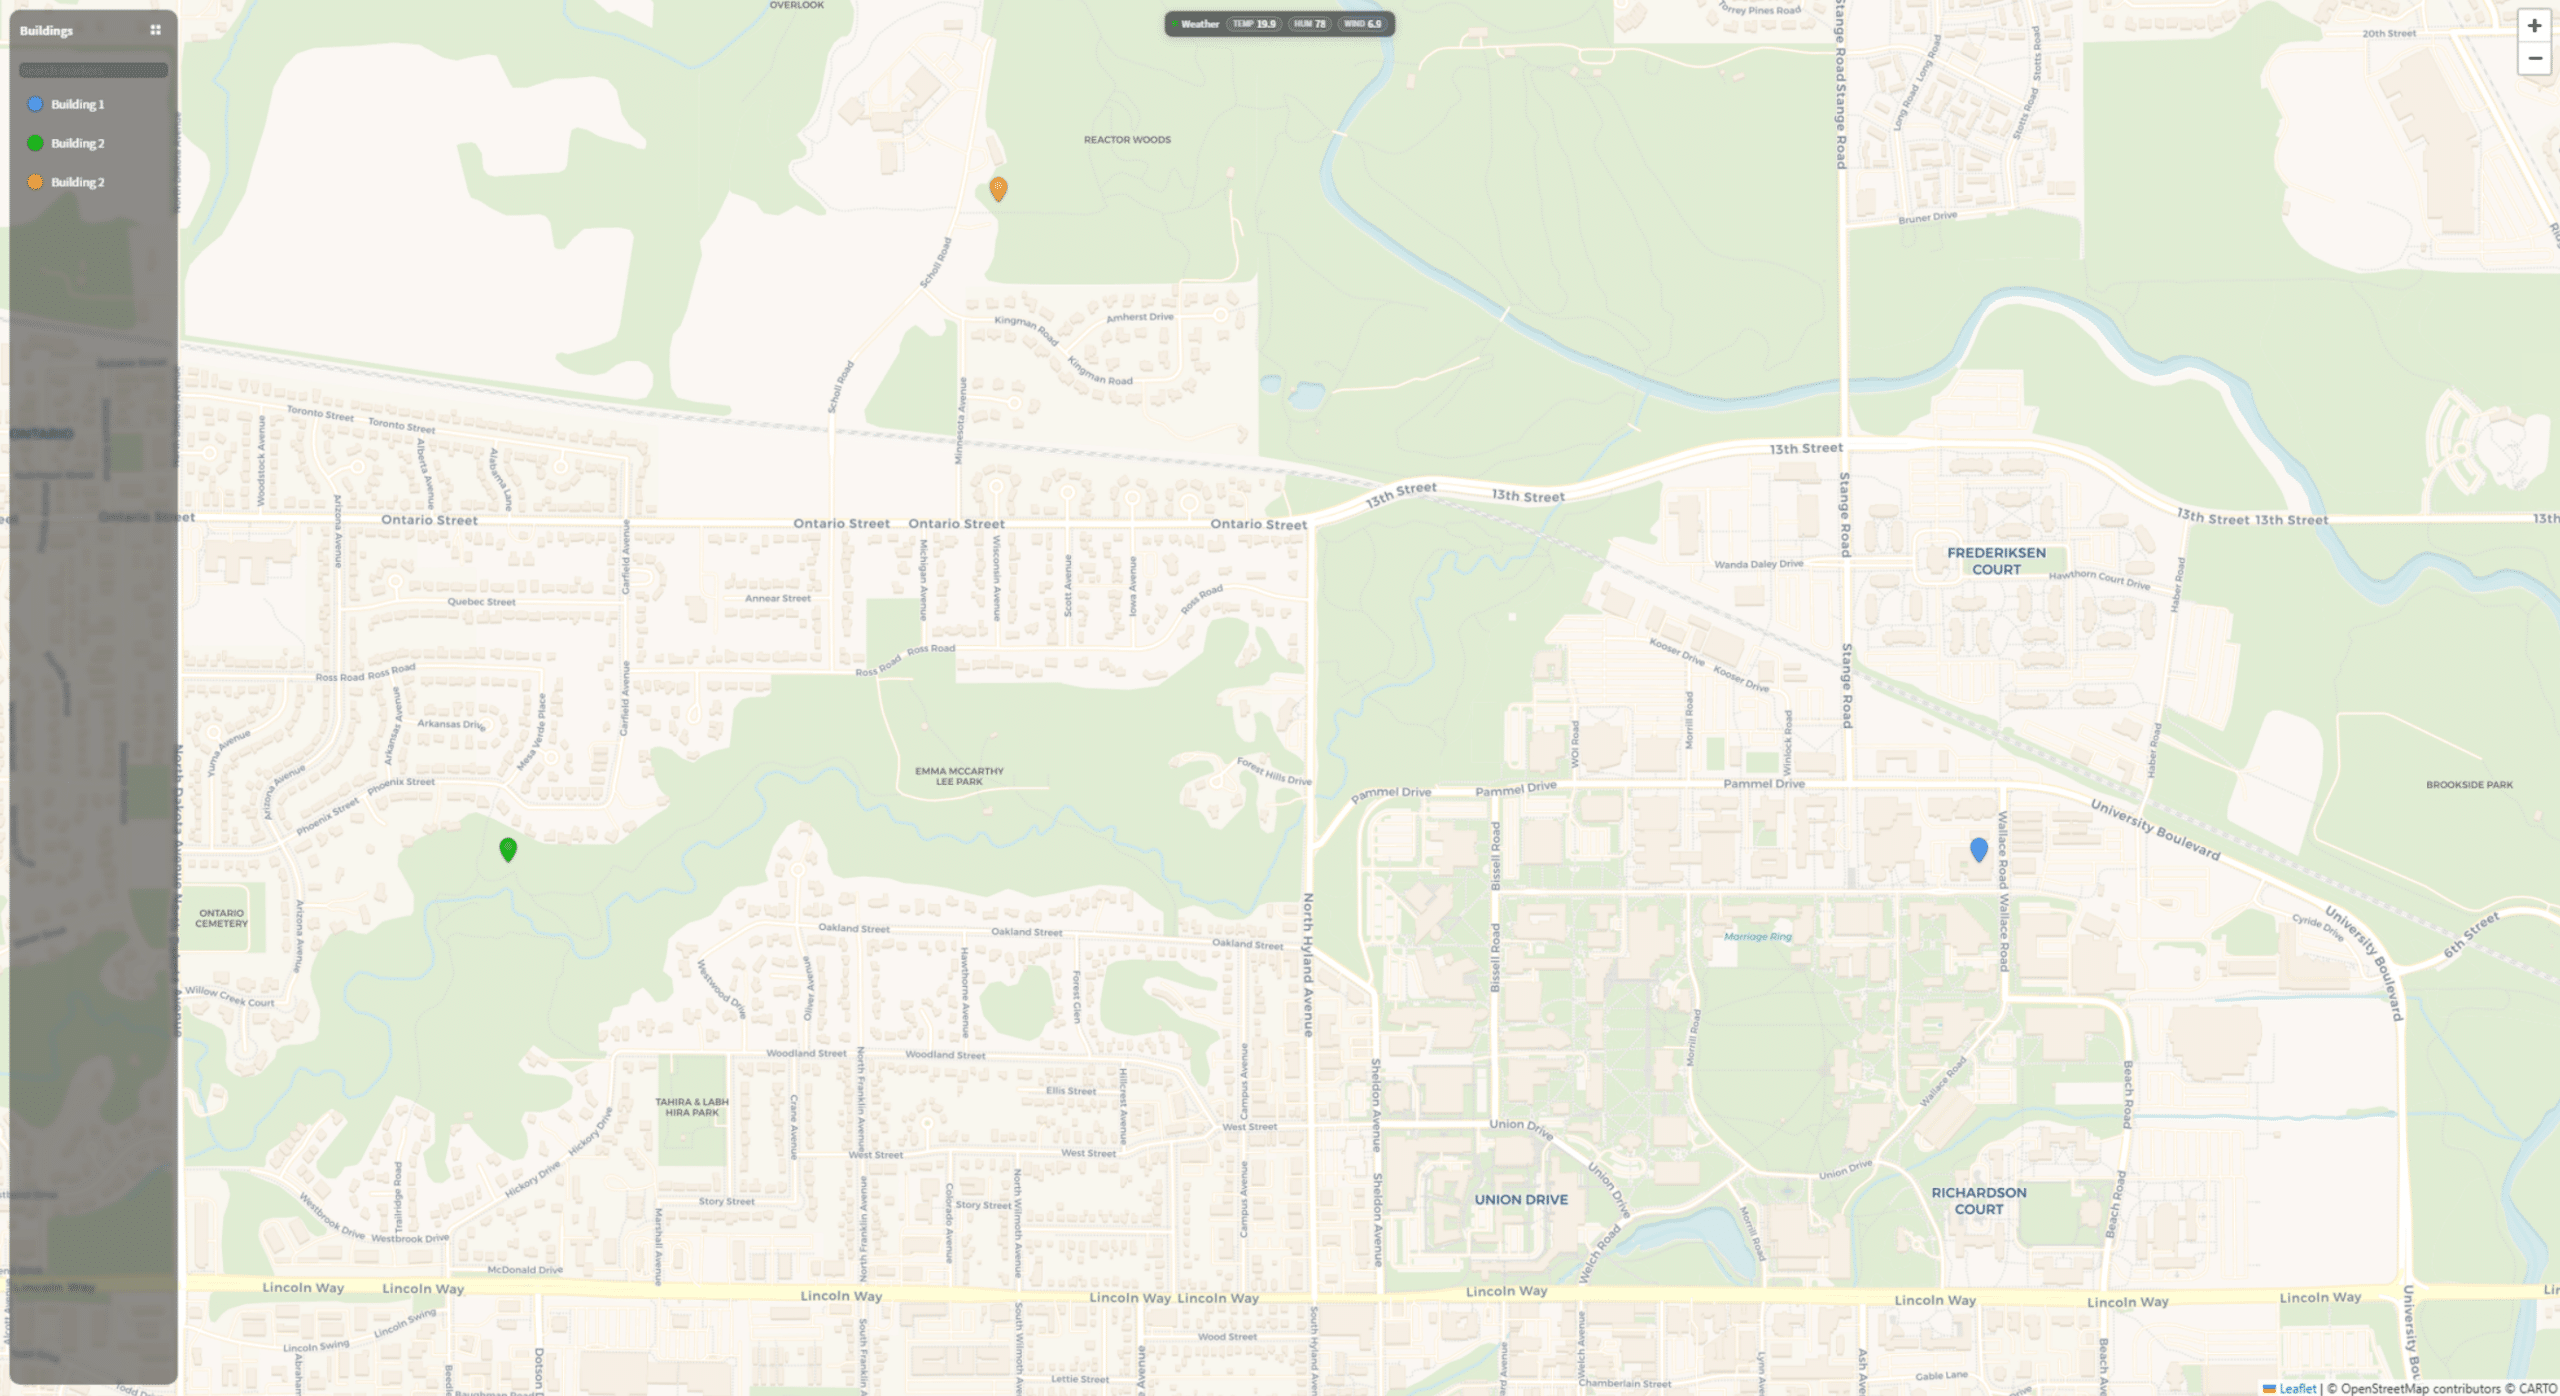
- Real-Time Status: Color-coded markers shift from green to amber to red as conditions change.
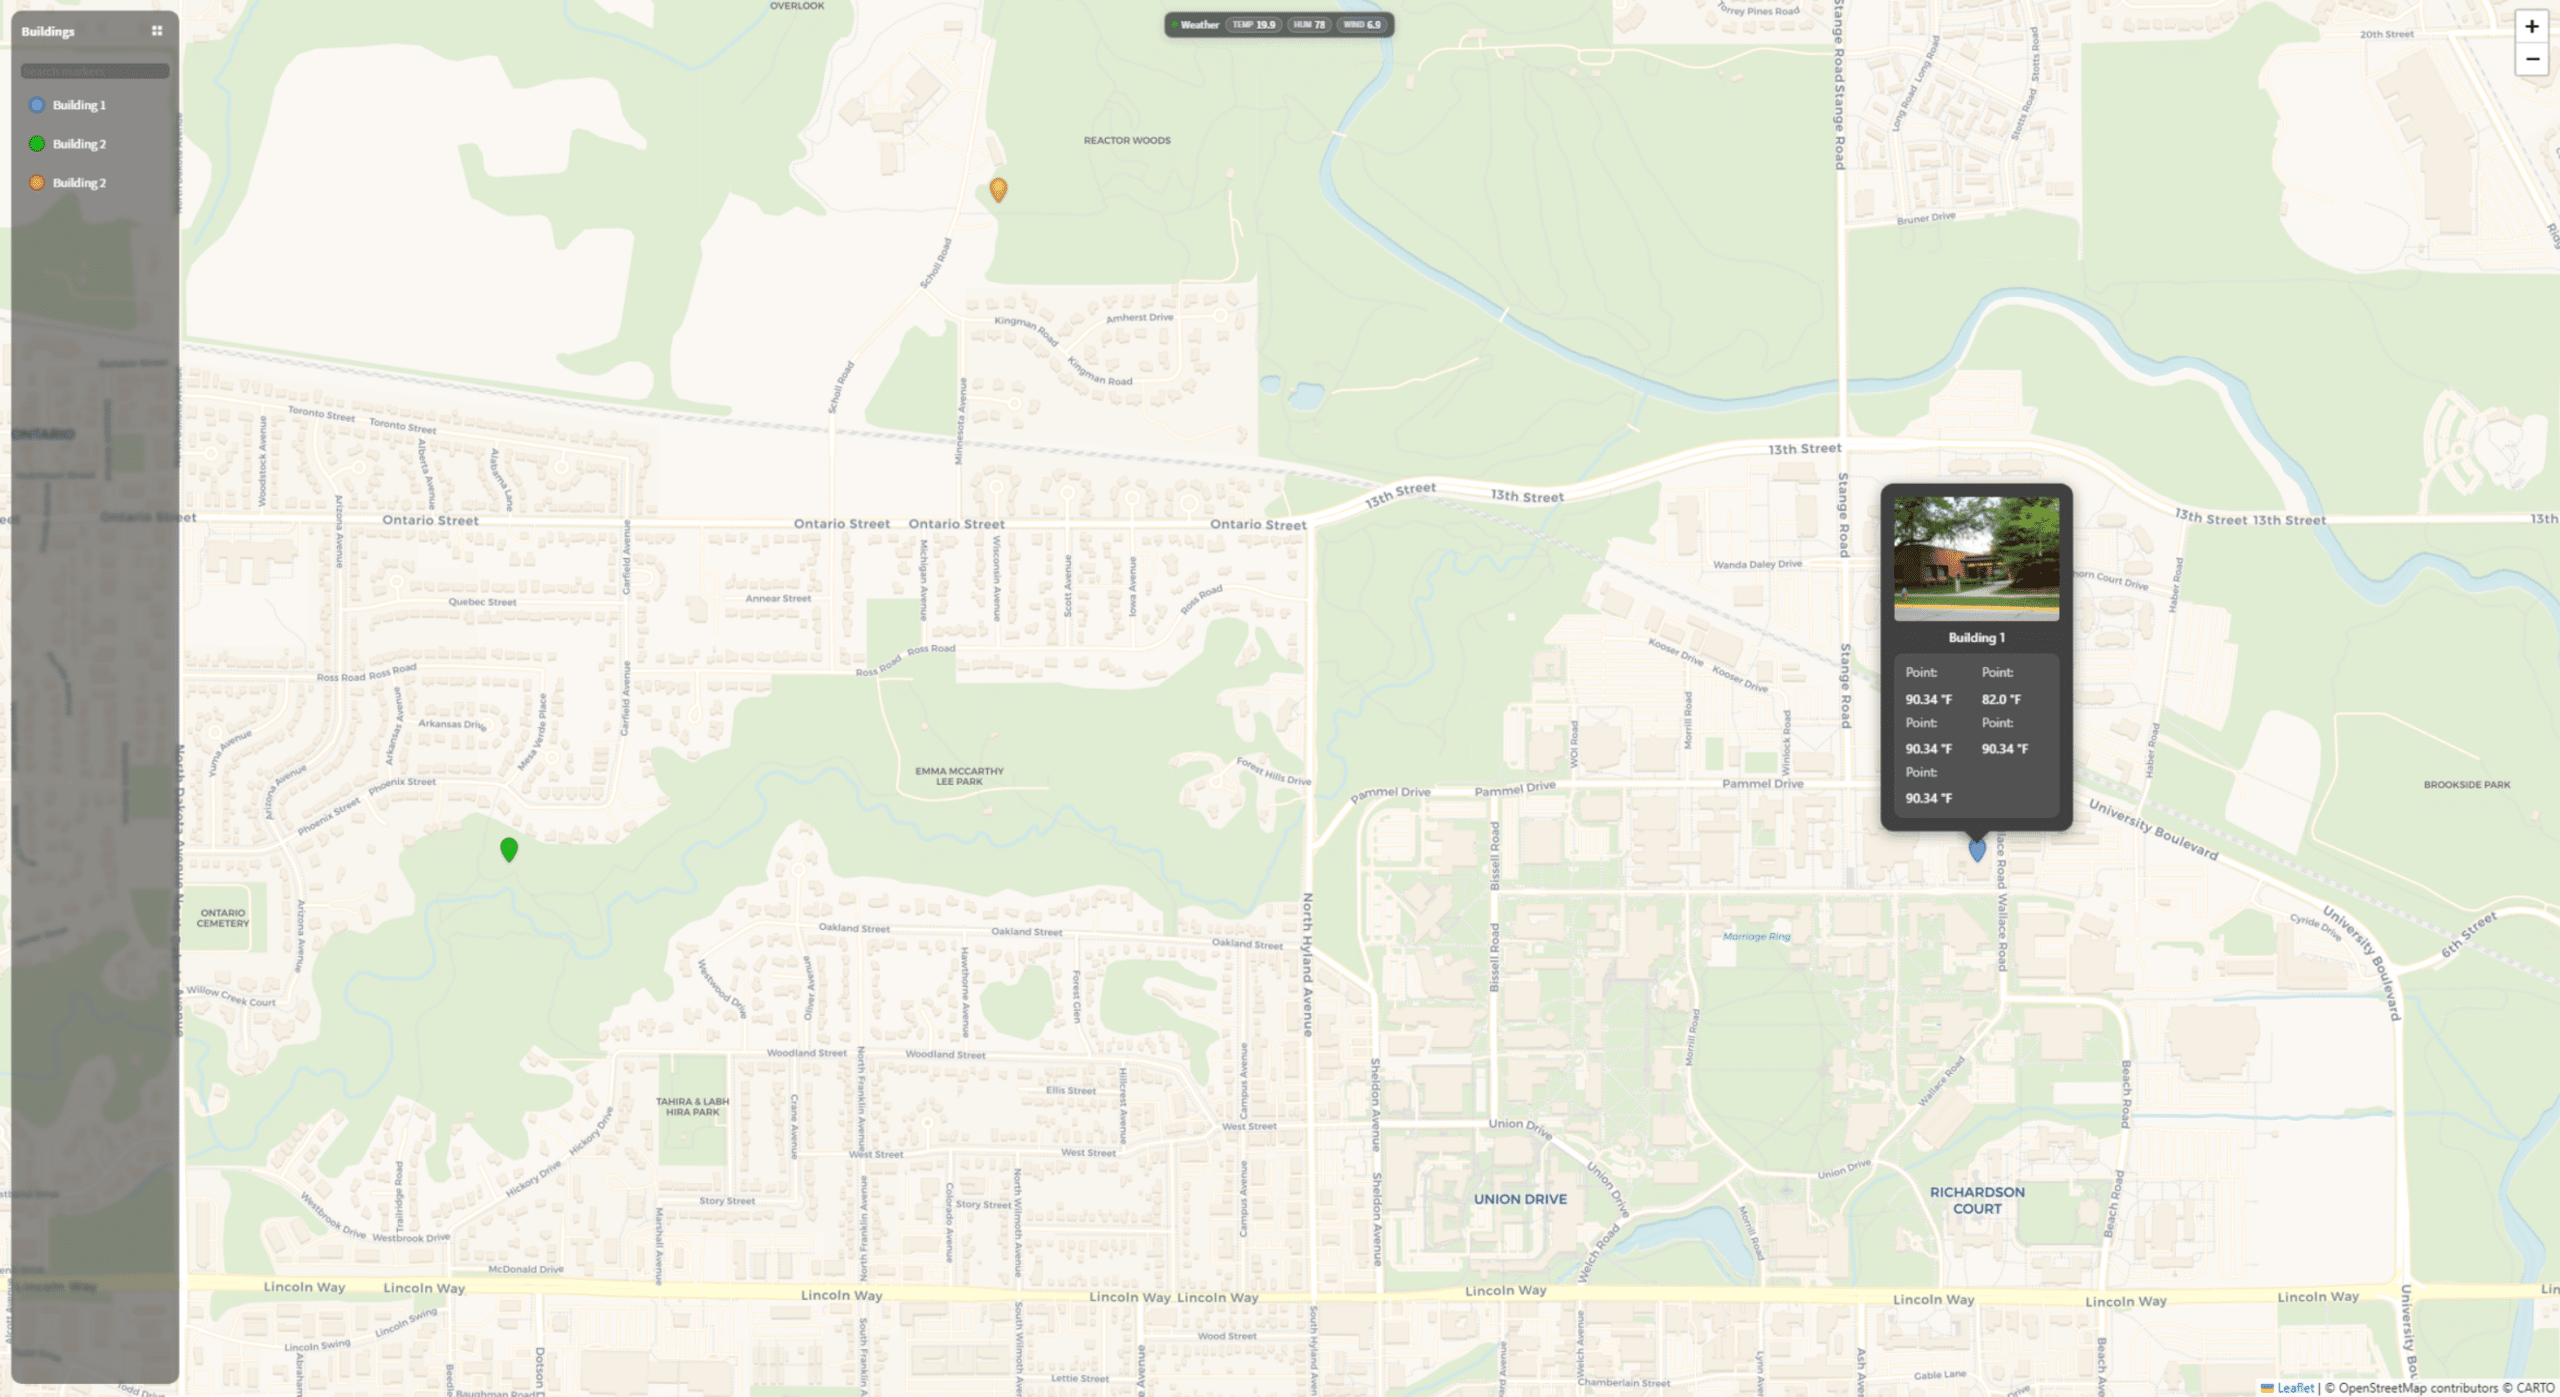
- Rich Popups: Building photos, live values, sparklines, alarm counts — all in one glance.
- Smart Legend: Filter, search, and expand into a full summary table overlay across the map.
- Flexible Styling: 7 marker shapes, 10 built-in icons, 4 map themes, and full ARGB color control.
Capabilities
- 4 visual styles: standard, muted, dark, satellite
- Configurable center, zoom, and bounds
- Auto-fit to markers on load
- Marker clustering for dense sites
- 7 shapes: pin, circle, dot, ring, square, diamond, triangle
- 10 built-in icons (building, hospital, school, etc.)
- Auto-colorize by severity thresholds
- Pulse, bounce, or blink animations
- Up to 5 live values per marker
- Alarm count badges
- Click-through links (HTTP or Niagara ORD)
- Optional weather banner
- Add License: Drop QAGSiteMapLicense under /Services
- Create Map View: Add QAMapsView and configure map settings
- Add Markers: Add QAMapMarker children with lat/lon and ORDs
- Drop Widget: Place MapView widget in your PX view
Ready to Get Started?
QAGSiteMap puts professional-grade data visualization at your fingertips — and getting stared is just as effortless as using it. Complete our short application, and our team will approve it in no time. No lengthy paperwork, no complicated setup — just fast access to the professional-grade data visualization tool you need.
Why Choose Us for Your BAS Graphics Needs?

Reduced Lead Time
Shorten the time it takes to deliver BAS graphics by outsourcing to our dedicated graphical team

Use The Experts
Have your team focus on programming and let us take care of the BAS graphics

Efficient Graphics
Create a standard within your company to maximize a creative look and feel for your end customer

Cost Savings
Increase your ROI by saving your technicians time and your budget by reducing graphical software when you outsource with us

Learn More About Our Full Suite of Services
QA Graphics is a full-service outsourcing company, providing custom HVAC system graphics, as well as design services for interactive platforms. We help clients visualize their needs and simply their lives. Our talented designers come form a wide range of backgrounds to provide the personal attention and expertise needed to being our clients’ ideas to life. Our partnerships with industry leaders like Johnson Controls and Schneider Electric ensure high-quality BAS graphics solutions.
Who We Are
We are a full-service outsourcing company, providing custom HVAC system graphics and BAS graphics design services for interactive platforms. Helping clients visualize their needs and simplify their lives, our talented designers come from a wide range of backgrounds to provide the personal attention and expertise needed to bring our clients’ ideas to life.
All of our work is completed in-house, with a team comprised of both creative and technical staff, including graphic designers, 3D designers, developers, programmers, architects, and mechanical engineers, to ensure we meet our clients’ diverse needs. We are a fun and creative group who takes pride in our Midwestern values and affordable prices.

FAQs
QAGSiteMap is a Niagara 4 module for building interactive site maps with real-time status monitoring. It ships as two JARs: QAGSiteMap-rt.jar (runtime components for QAMapsView and QAMapMarker) and QAGSiteMap-ux.jar (the Leaflet-based MapView web widget). You place the widget on a Px page and bind it to a QAMapsView component in your station tree.
Drag a QAMapsView from the palette into your station, set centerLat, centerLon, and zoom, then add QAMapMarker children underneath it — one per location — each with a markerName, lat, and lon. Finally, drop the MapView widget onto a Px page and bind it to your QAMapsView. The user guide recommends confirming the first marker displays before adding the rest.
Set a statusOrd on the marker and ensure statusColorize is true. The statusType property controls how the value is interpreted: auto infers the type, numeric compares against statusWarnThreshold (default 70) and statusAlarmThreshold (default 90), boolean treats true/on/active as alarm, and enum does a case-insensitive match against statusEnumWarn and statusEnumAlarm.
Each QAMapMarker supports up to 5 live value rows (value1Label/value1Ord through value5Label/value5Ord), an optional alarm count via alarmCountOrd, an image via imageUrl, and a clickable link via the link property. You can also enable showPopupSparkline on the QAMapsView to display mini trend charts for each value row.
Yes. Each marker has a markerStyle property (pin, circle, dot, ring, square, diamond, or triangle) and a markerIcon glyph (building, hospital, school, office, factory, warehouse, power, water, star, or none). For animations, set markerAnimation to pulse, bounce, or blink, and use animationState to control when it triggers — always, on any active status, on warn+alarm, or alarm only.
Yes to both. On the QAMapsView, set clusterMarkers to true and configure clusterRadiusPx and clusterMaxZoom to group nearby markers at lower zoom levels. For weather, set showWeatherBanner to true and bind weatherTempOrd and weatherHumidityOrd to your station’s weather points — the banner currently supports temperature and humidity.
Our Customers

QA Graphics did an exceptional job on the graphics for our recent project, which was full of confusing and complex systems. You would almost think that QA Graphics was part of the project from the beginning. In fact, I have been surprised many times to find that little obscure things were picked up on that I was sure would be missed. I REALLY appreciate the work QA Graphics did on this project.
JAMES PLATANIA
Senior Systems Engineer
– Johnson Controls, Inc –
I would like to throw a huge shout-out to you and your team for all the hard work on the project. After downloading the new MUI package we expected to see problems and were prepared to come back to QA with a bunch of fixes. This was not the case at all. QA really nailed it on this one and we at JCI are so thankful that you are part of the team!! This was by far the smoothest package that we have had to drop in and it really made us look good in front of this customer. This site has now become a showcase piece for future MUI sites and we are excited to show off the work that was done. Again, thanks so much for all the hard work and please let your team know how much we appreciate them going the extra mile to get this done in such a tight time frame. Looking forward to continuing the relationship and growing together as the future brings on more exciting projects.
Brett C.
Account Service Representative
– Johnson Controls, Inc –
Featured BAS Graphics Posts

As AI continues to transform industries, you might wonder why QA Graphics hasn’t fully automated the creation of BAS graphics and 3D floor plans. While AI is a powerful tool, it still falls short when handling the complexity and inconsistency of the assets you provide.

UI and UX continue to be undervalued in the building automation system (BAS) industry. We are seeing a shift at [...]

QA Graphics has officially launched QAGFoxhound, a desktop application engineered for the Tridium Niagara platform that assists system integrators in [...]

At QA Graphics, our mission has always been clear. We help system integrators deliver better building automation graphics through experienced [...]