• Skip to primary navigation
  • Skip to main content
White logo with a geometric hexagon shape on the left and the text “QA GRAPHICS®” in capital letters on the right, all against a light gray background.

QA Graphics

Innovative BAS Graphics

  • BAS Services
    • System Graphics
    • 3D HVAC Graphics
    • v5 Symbol Library
    • Vector Symbol Library
    • 3D Room System Library
  • Creative Services
    • Videos & Motion Graphics
    • 3D Design
  • Floor Plans
    • Floor Plans
    • Navigation Graphics
  • Company
    • About Us
    • Careers
    • FAQ
    • Who We Work With
    • Case Studies
  • The Visual Layer: QA Graphics Blog
  • Request a Quote
  • 515-965-3403
  • Show Search
Hide Search

Who We Work With

Who We Work With

We work with clients in a variety of industries. Our trained mechanical graphical staff are the leading developers in BAS (building automation system) graphics for System Integrators, Commercial Real Estate Brokers, and more. We have completed custom BAS graphic libraries for six of the largest control companies in the building automation industry. Learn more about who we work for. Please reach to see if your project would be a good fit.

Contact Us Today

Some our customers' most common job specialties

Johnson Controls Job Specialties

Customer Operations Associate
Branch Installation Manager
Account Executive
Lead Systems Specialist (I, II, III)
Project Administrator
Technical Team Leader

Trane Job Specialties

Controls Project Specialist
Contracting Project Manager
Engineering Specialist
IS Team Lead
Project Engineer

Other Job Specialties

Senior Project Manager
BAS Technical Manager
Operations Manager
Automation Controls Field Supervisor
Controls Sales and Engineering

Case Studies

Nortek Sales Tool Navigation

QA Graphics Project Spotlight: Nortek Global HVAC Division Interactive Sales Tool

QA Graphics (booth C1381) partnered with Nortek Global HVAC Division (booth C3129), to provide a state-of-the-art interactive sales tool application with a larger range of services that utilized the companies many talents. Nortek came to QA Graphics needing…

Read More
Energy dashboard banner image

Integrate Your Energy Building Data into Your Classroom

Educate Students with Real Time Data & Become LEED Certified QA Graphics’ award winning Energy Dashboard, educates building occupants with […]

Read More
AMP American Midwest Power

QA Graphics Creates a Creative Marketing Tool for American Midwest Power

QA Graphics’ award winning design team has created a new marketing tool for Edgeton Sales Inc. to enhance customer awareness […]

Read More

Frequently Asked Questions

Do you outsource any of your services to a foreign county or other?

No, we do all our own work in house at our office in Ankeny, IA

What is the turnaround time for a quote?

Almost all quotes will be turned around within a day.

Large campuses may take 2-3 days.

What files are needed to create a quote?

For floor plans: We will require a drawing of the floor(s) for the project and we will need to know what template and package you’re wanting quoted

For 3d Equipment: We will require a PDF submittal of the unit showing both the exterior and interior of the unit. Detailed 3D CAD files (.STEP, .IGES, etc.) can also help result in a more detailed rendering.

For Graphic outsourcing: We will require control drawings and floor plan files or database backup with existing graphics

What is the business process once an order is placed?

Once we have the project secured it is turned over to our project manager. The project lives in our project management software. All parties involved are included in the communication throughout the project.

When do you expect payment?

We invoice once the project is awarded, payment is not due until the project is delivered or we have a payment schedule agreed to.

Symbol Libraries and 3D equipment are not delivered until payment has been received.

JCI

Floor plan layout showing rooms labeled HP-31 to HP-58, with red dots marked “Point Info” in each room. North direction is indicated at lower right. Johnson Controls logo appears in the top right corner.
3D floor plan showing multiple labeled rooms with status indicators (ALARM, NORMAL, EVAC) on the left. Interactive buttons and overlays for weather, OAT, and OAH point info appear at the top right.
A floor plan labeled with room numbers, yellow circles marking "Point Info" locations, and a legend showing ANALOG (yellow) and AMS/LOOP (red) points. Some rooms and paths are outlined in red.
3D diagram of a clean corridor showing air pressure zones, airflow directions, and door locations, with a control panel on the right listing various system parameters and point information in a tabular format.
3D floor plan of a building with several labeled zones (ZN-1 to ZN-7) and the central area marked as "GYM-1." Each zone has a "Point Info" label. A purple header shows "Logo Building Title.
Diagram of an HVAC air duct system showing air flow paths, sensors, dampers, and variable frequency drives (VFDs), with labeled components and “Point Info” buttons for detailed data access. Johnson Controls and NOAA logos are present.
Schematic diagram of an HVAC air handling system with labeled components, sensors, and control points, including dampers, filters, coils, fans, and variable frequency drives, connected throughout ductwork channels.
A schematic diagram of a building’s HVAC system, showing airflows, equipment, and control points labeled with acronyms. A table of system setpoints and parameters is displayed at the bottom right.
A digital schematic of a building’s HVAC system, showing airflow paths, ductwork, fans, filters, dampers, and labeled zones including stage, gymnasium, and gym controls, with parameter and point info menus on the top right.
A labeled diagram of an HVAC air handling unit with visible components such as a fan, coils, and filters, along with buttons for detailed point information and system parameters on the right side.
System diagram showing interconnected blue and green pipelines with labeled pumps, valves, chillers, and cooling towers. The layout represents a chilled water and condenser water system for HVAC operations.
Diagram of a cooling system showing flows between an adiabatic cooler, chiller, pumps, and pipes with labeled points, color-coded lines (green and blue), and system parameters listed in boxes on the right.
Diagram of an air handling unit showing airflow, filters, fans, cooling and heating coils, dampers, and sensors, with labeled system parameters and control points for temperature and pressure.
A diagram of an air handling unit system shows airflow through dampers, a fan, a heating/cooling coil, and sensors, with labeled control points and system setpoints displayed on the image.
A labeled diagram shows an HVAC air duct system with components including sensors, damper, reheat coil, and wiring. A control system menu appears on the right, and a purple header displays "Logo" and "Building Title" at the top.
Aerial view of a building complex surrounded by trees and parking lots, with a user interface below showing buttons for air, water, and miscellaneous systems, and floor plans.
A digital building control dashboard displays images and diagrams of water and air systems, system statuses, system names like steam boiler and exhaust fans, and navigation buttons for different building floors on the left.
Digital floor plan for Bendwood Elementary, showing labeled rooms, offices, cafeteria, lounge, labs, and mechanical rooms. A key lists air handling units, and icons indicate chilled and hot water systems.
Screenshot of a building management system interface showing a photo of a building, floorplan options, and clickable buttons for air and water systems status, temperature readings, and miscellaneous controls.
Diagram of an industrial piping system with red and blue pipelines, tanks, pumps, valves, and labeled components, showing flow directions and connection points for process monitoring and control.
Diagram of an air handling unit (AHU) system, showing labeled ducts, fans, sensors, and connections with color-coded lines representing airflows and control points in a building HVAC layout.
A complex schematic diagram showing interconnected pipelines, valves, pumps, and equipment. Red, yellow, and blue lines represent different flow paths with labeled control points, set against a blue technical interface background.
Diagram of an HVAC air handling unit system, showing airflow paths, sensors, fire dampers, temperature, and humidity setpoints, with labeled points for monitoring and control throughout the ductwork.
Map showing locations of schools in Niagara Falls, NY, including Maple Avenue Elementary, Kalfas Elementary, and Niagara Falls High School, with each school marked by a blue pin and labeled with its name.
Map of Spring Branch ISD with locations of pre-K centers, elementary, middle, and high schools, plus charter schools and district facilities, marked with icons. Legend and school names are shown on the left.
A color-coded site map with labeled areas including Service North, Service East, CUT/F Pumphouse, Cases, Mission, LIW, MSS Control, and Swan Lake Pumphouse. Panel buttons are shown in the top corners.
A digital schematic of an HVAC system showing airflow paths with labeled points for OA, RA, SA, and filters. Blue and yellow highlight areas for settings and system information. Johnson Controls logo is in the bottom right corner.
A building dashboard displays a photo of a brick building, water and air system controls with gauges and fan icons, floorplan links, and lighting options with point info buttons on a white and blue interface.
A digital building floor plan with labeled rooms and zones in blue shades. A sidebar on the right displays layer options, including room numbers, zoning, ductwork, suites, background, and master layer, with checkboxes for each.
3D floor plan of Main Level - A showing multiple rooms labeled 420W to 417W, a Shaft Room, H.M.C., stairs, exit info, and a central hallway, with a small overview map in the bottom left corner.
A digital diagram of an HVAC air handling unit shows air flow direction from supply air (SA) to discharge air (DA), with visible ductwork, a control box, and a coil component. The interface has a Home button and control panel at the top.
A schematic diagram showing a hydronic heating system with three boilers, pumps, expansion tanks, valves, a filter, and labeled hot water supply (HWS) and hot water return (HWR) lines connected by red piping.
A digital dashboard displays a 3D rendering of a building with labeled sections for Air Systems, Floor Plans, Water Systems, and Miscellaneous Systems, each with lists of items and question marks as placeholders for data.
3D floor plan of a building with multiple labeled rooms and corridors, each marked with alphanumeric codes such as 1-411, 1-418, and 1-421. The layout shows walls, doors, and open common areas.
Diagram of an HVAC system with labeled airflows: EA (exhaust air), OA (outdoor air), SA (supply air), and RA (return air). The image shows two main sections with system components at each end.
A schematic diagram shows a building’s chilled water system, with blue and green lines indicating water flow through pumps, chillers, valves, and cooling towers, labeled with equipment names and point info under the Johnson Controls logo.
A detailed HVAC system diagram with labeled airflow paths, dampers, sensors, fans, and control panels, illustrating equipment points and connections for a building automation system by Johnson Controls.
A building photo is shown on the left. On the right, there are system status panels for AHU-1, AHU-2, and AHU-3, along with floor status summaries for Basement through Roof. Johnson Controls logo is at the bottom right.
A 3D floor plan layout of UC Davis Medical Center, showing multiple rooms labeled with numbers and “Point Info” markers on various walls. The Johnson Controls and UC Davis Medical Center logos are displayed.

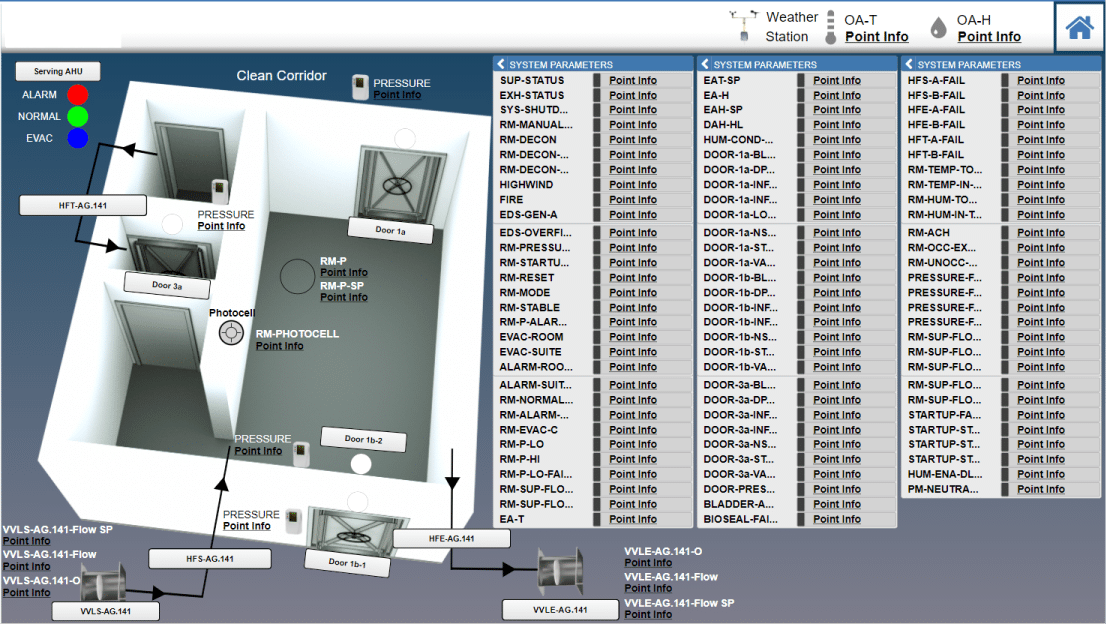
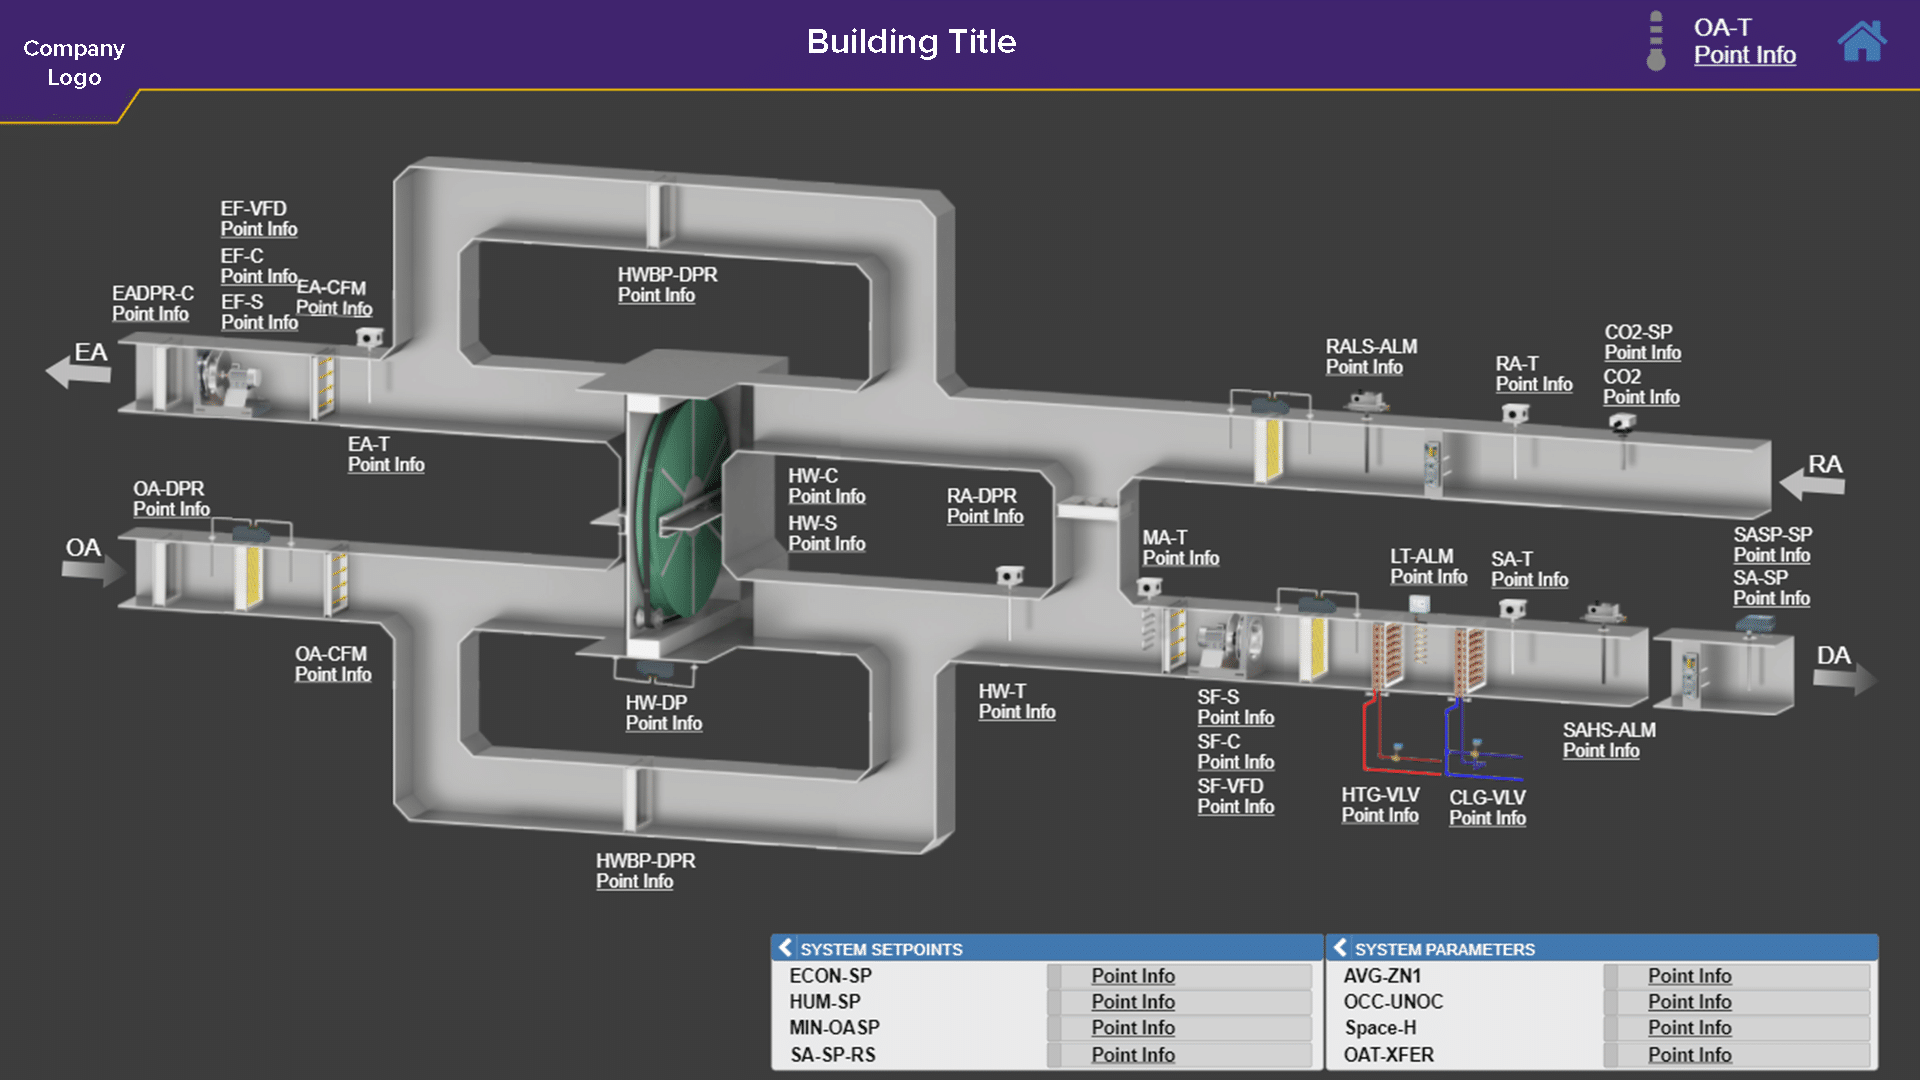
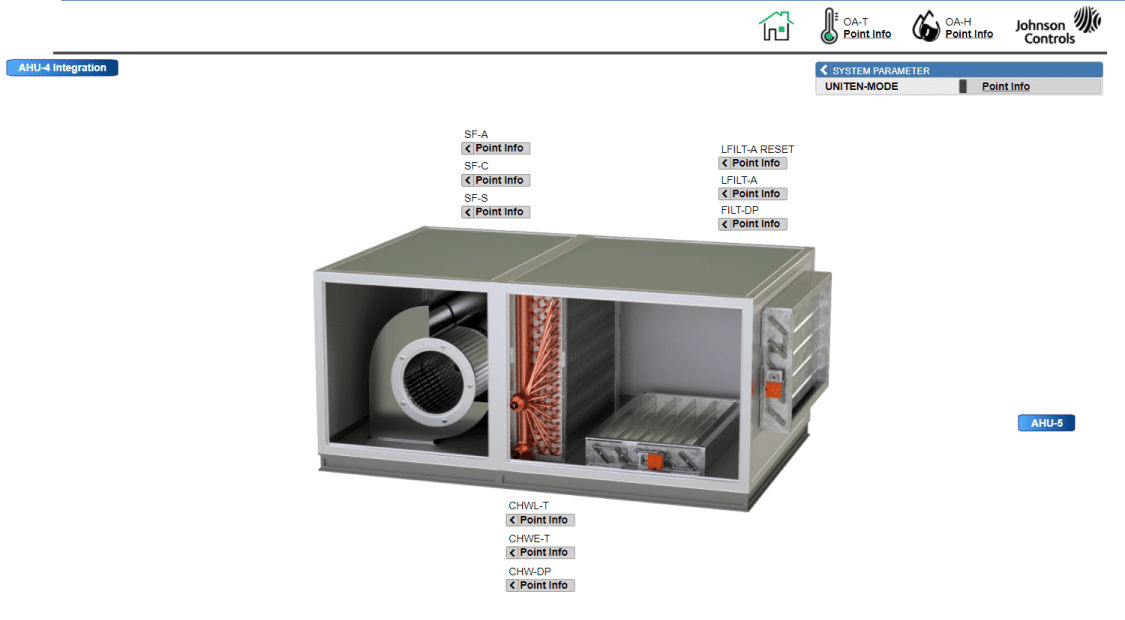
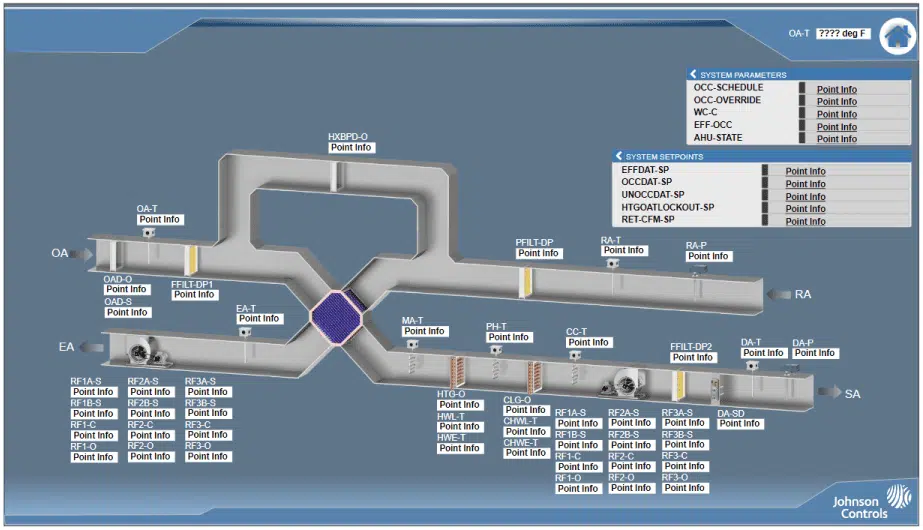
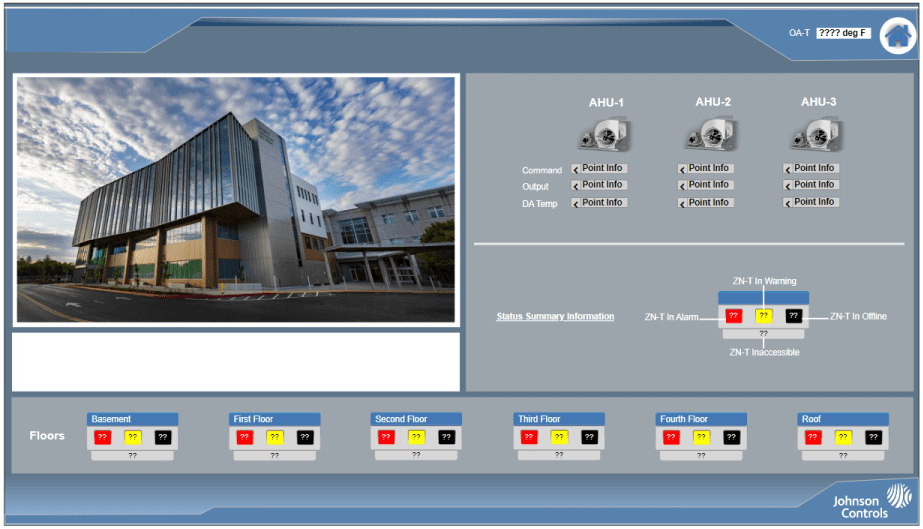
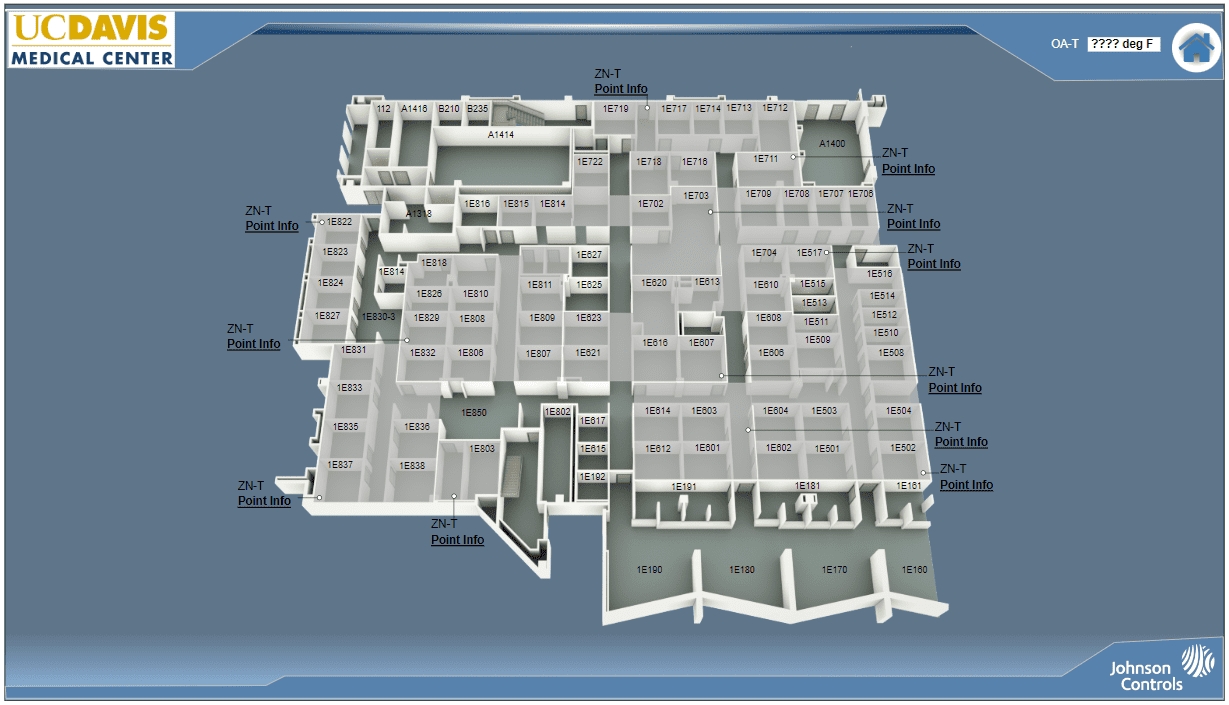
QA Graphics is the industry-leading provider of comprehensive BAS graphics services for Johnson Controls, Inc. projects. Johnson Controls has named QA Graphics as one of only two pre-qualified subcontractors with the ability to perform graphical work. Our skilled mechanical engineers can create the best system graphics for Metasys UI and Graphics+. Everything is done in-house, here in the United States, with nothing outsourced overseas.

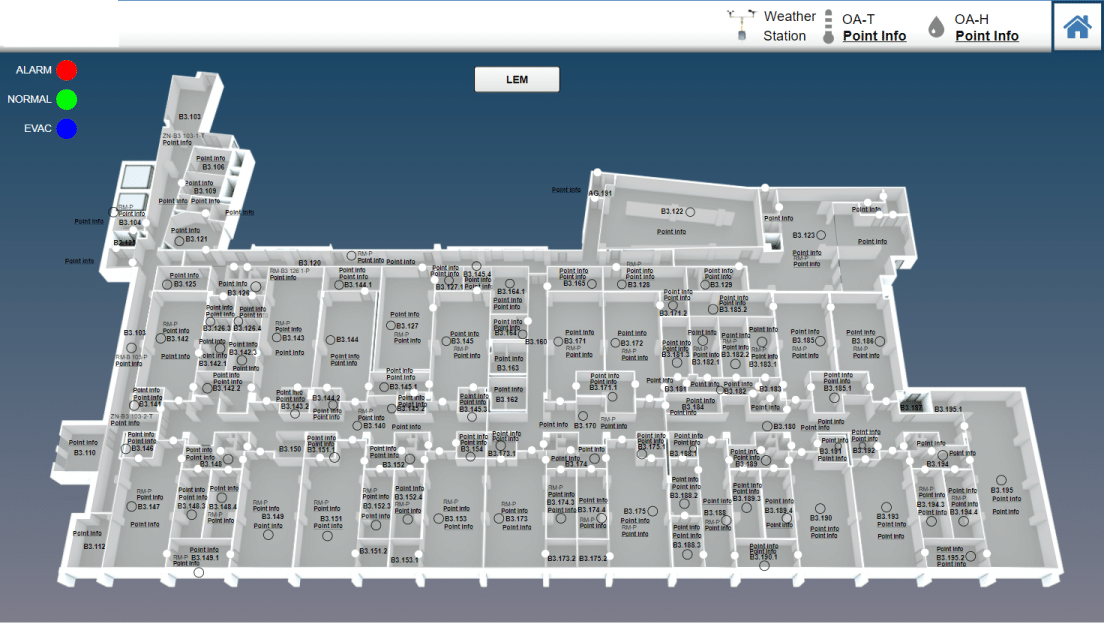
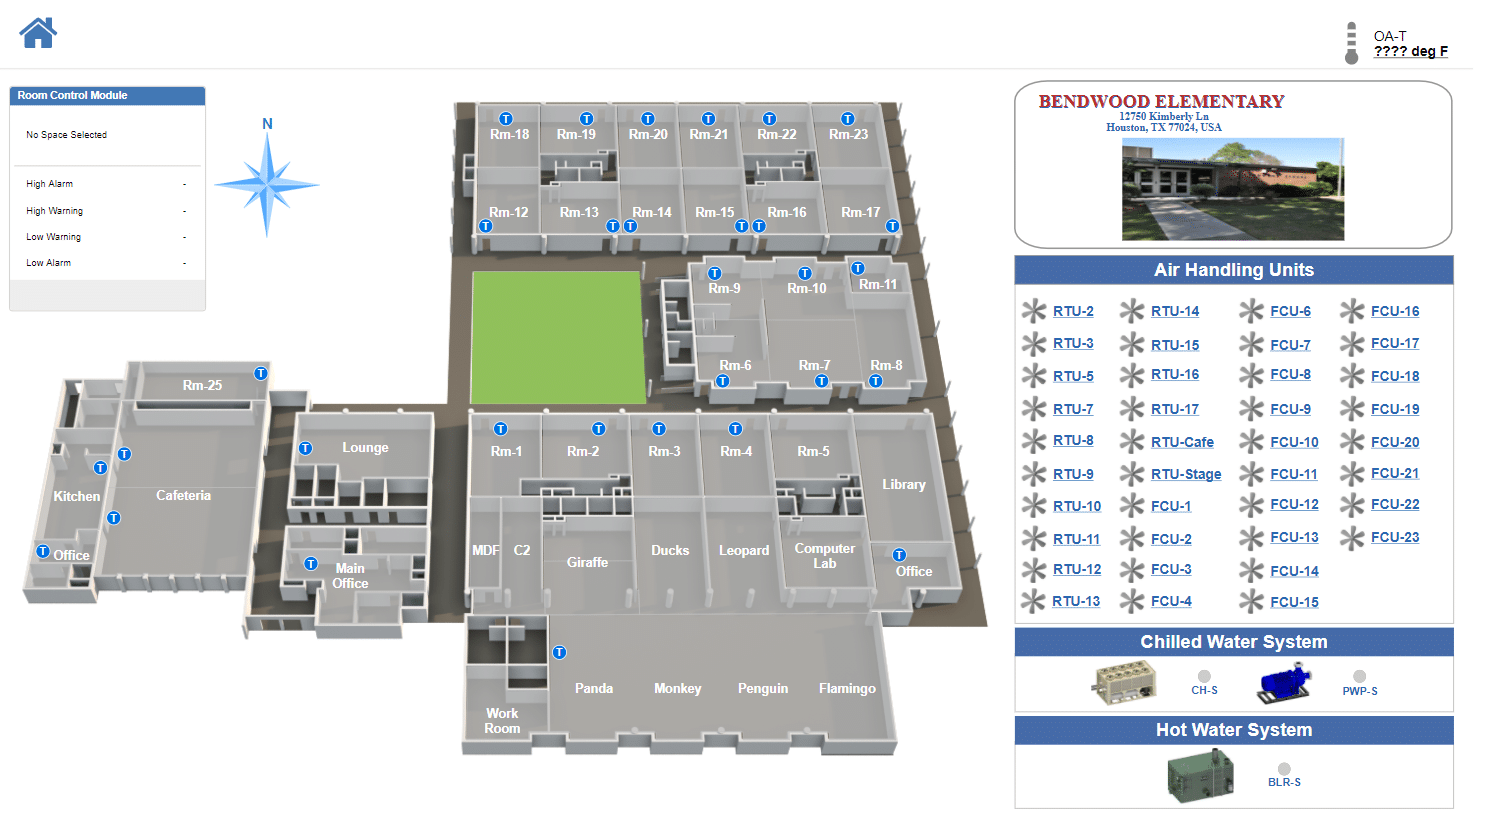
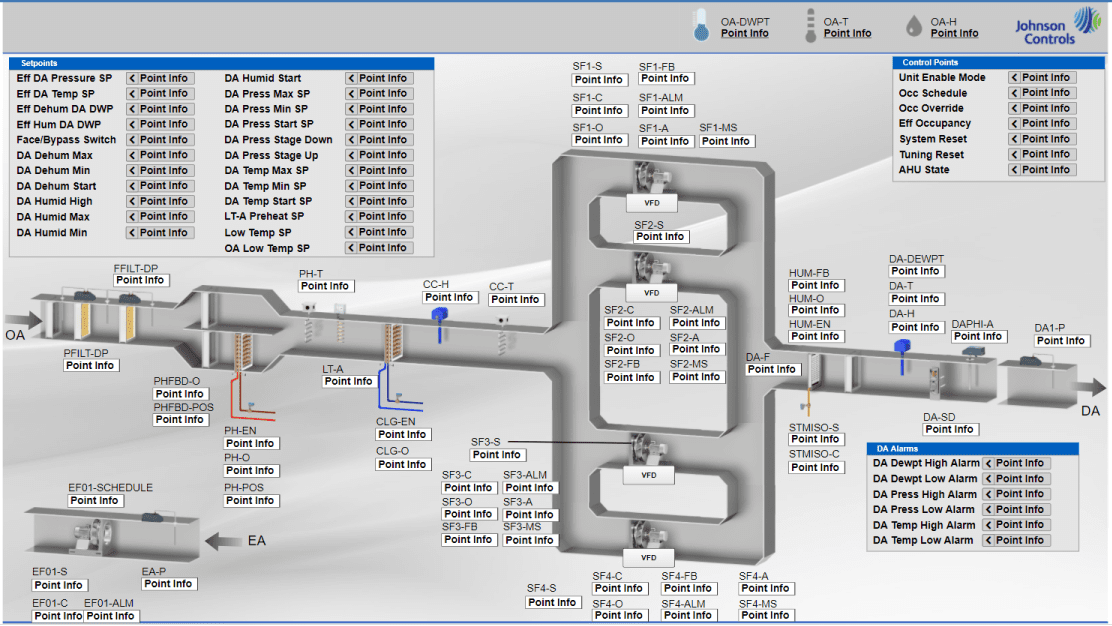
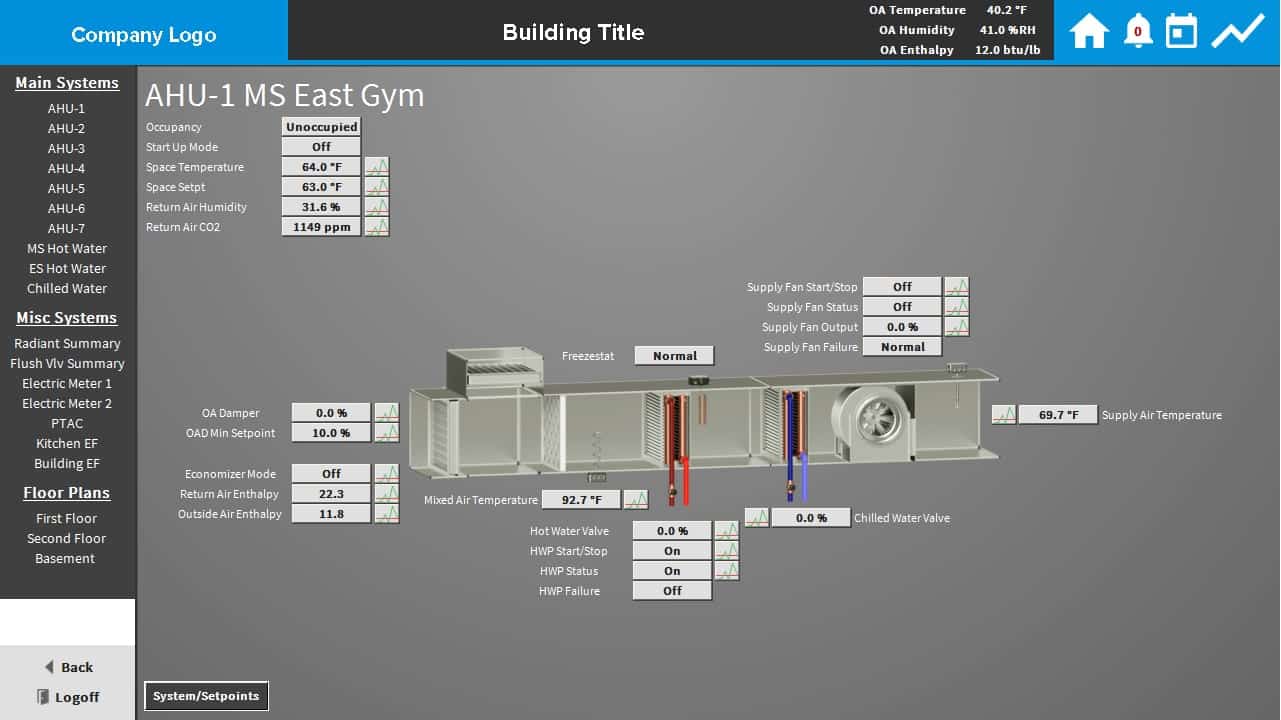
Our team is trained in creating all Metasys UI (MUI) graphics, as well as the spaces and definitions that drive the front-end graphics. MUI is an efficient software that allows the user to provide photo-realistic images of equipment, systems, and floor plans. Our team provides consistent, high-end graphics for a customer from start to finish with a submittal process to ensure that each customer is provided exactly what they need on a project-by-project basis.

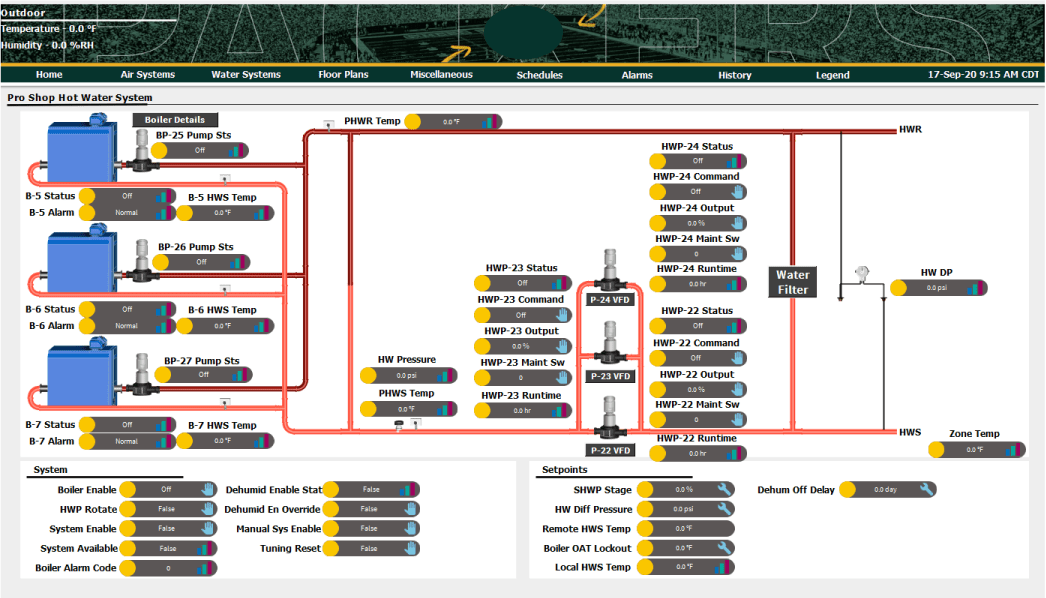
Graphics+ graphics are designed with the Graphic Generation Tool (GGT) – a powerful diagramming tool that helps designers create compelling representations and bind them to data objects.

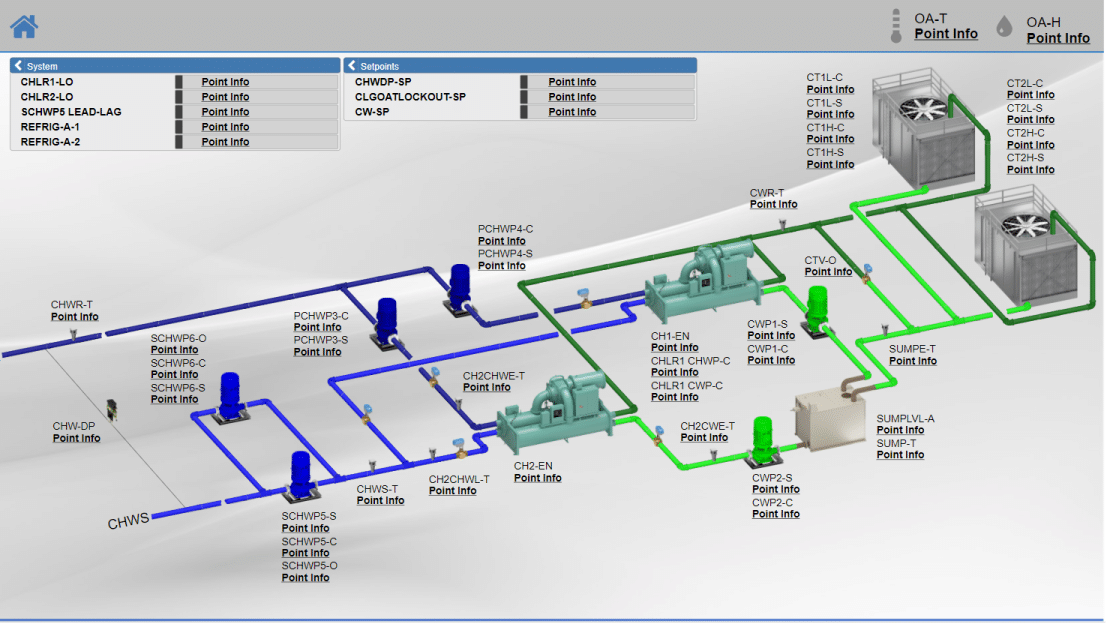
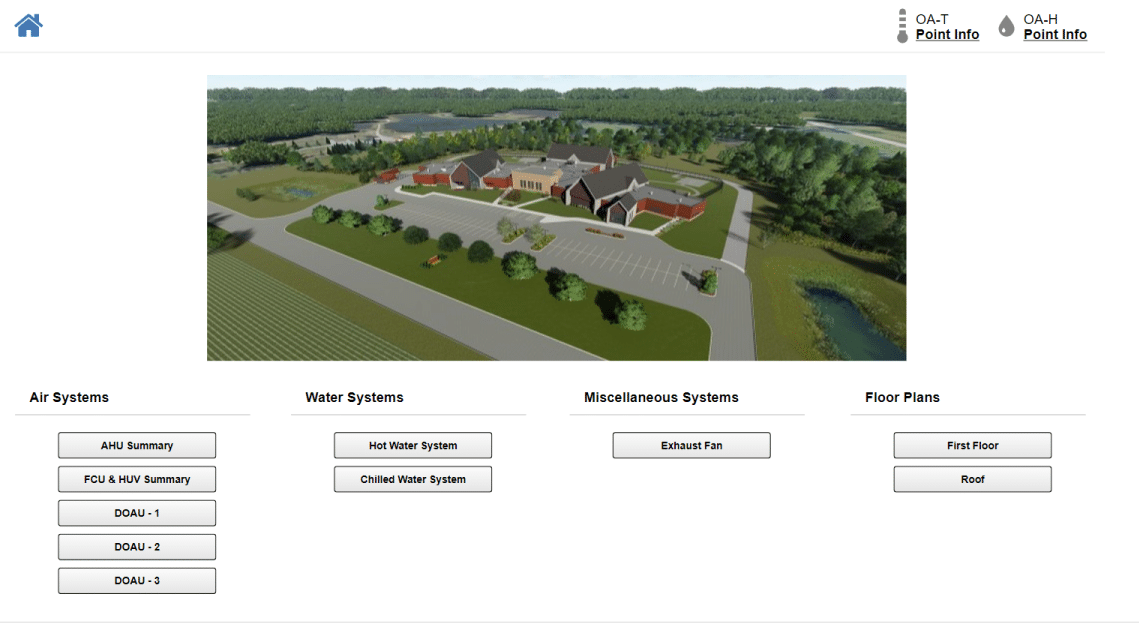
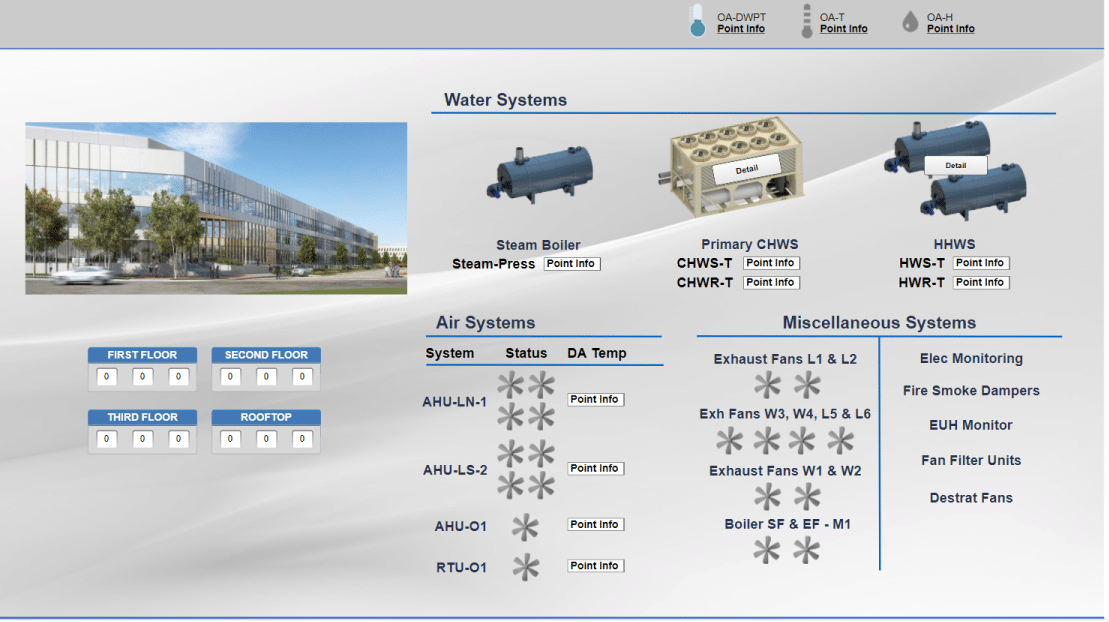
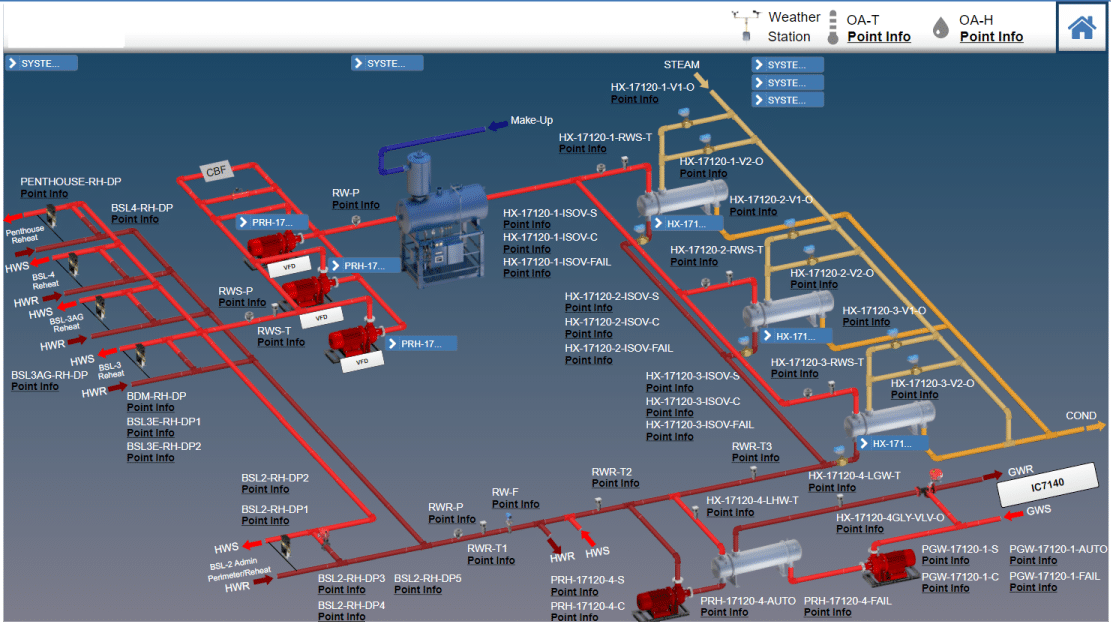
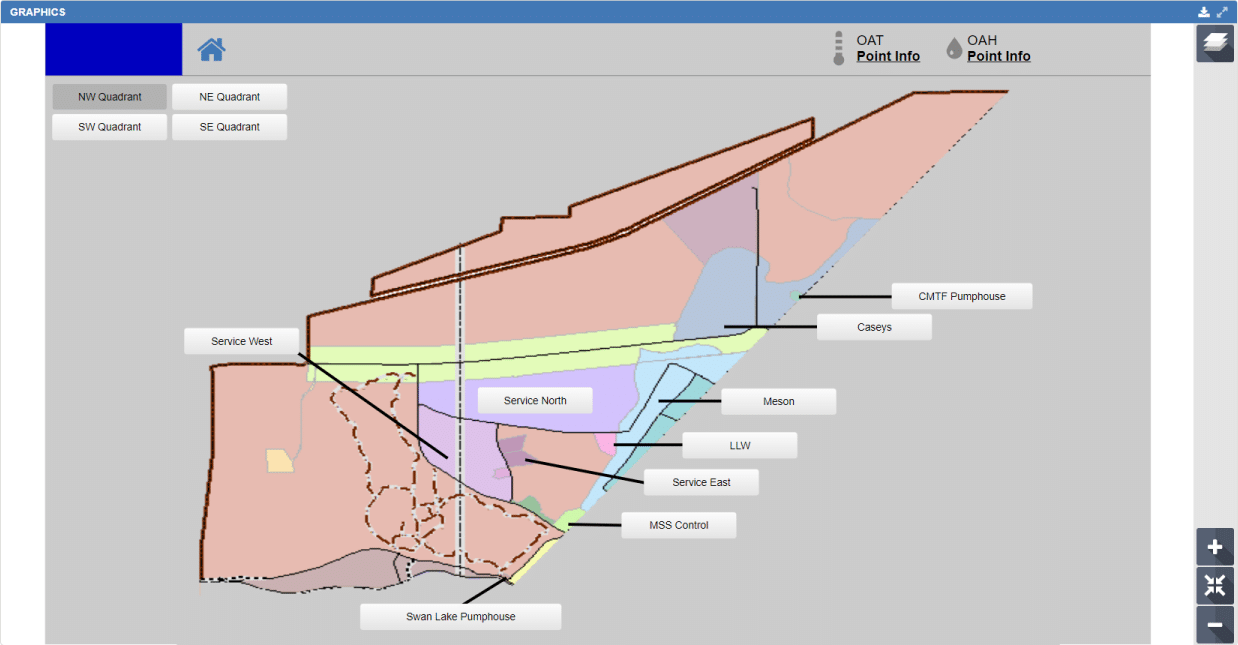
NIAGARA SYSTEM GRAPHICS

Niagara 4 Water Vector Graphic
Custom AHU unit on building controls software
Custom chilled water system in Building Controls software
Custom site map in Building Controls software
Custom air handling unit in Building Controls software
Custom hot water system in Building Controls software

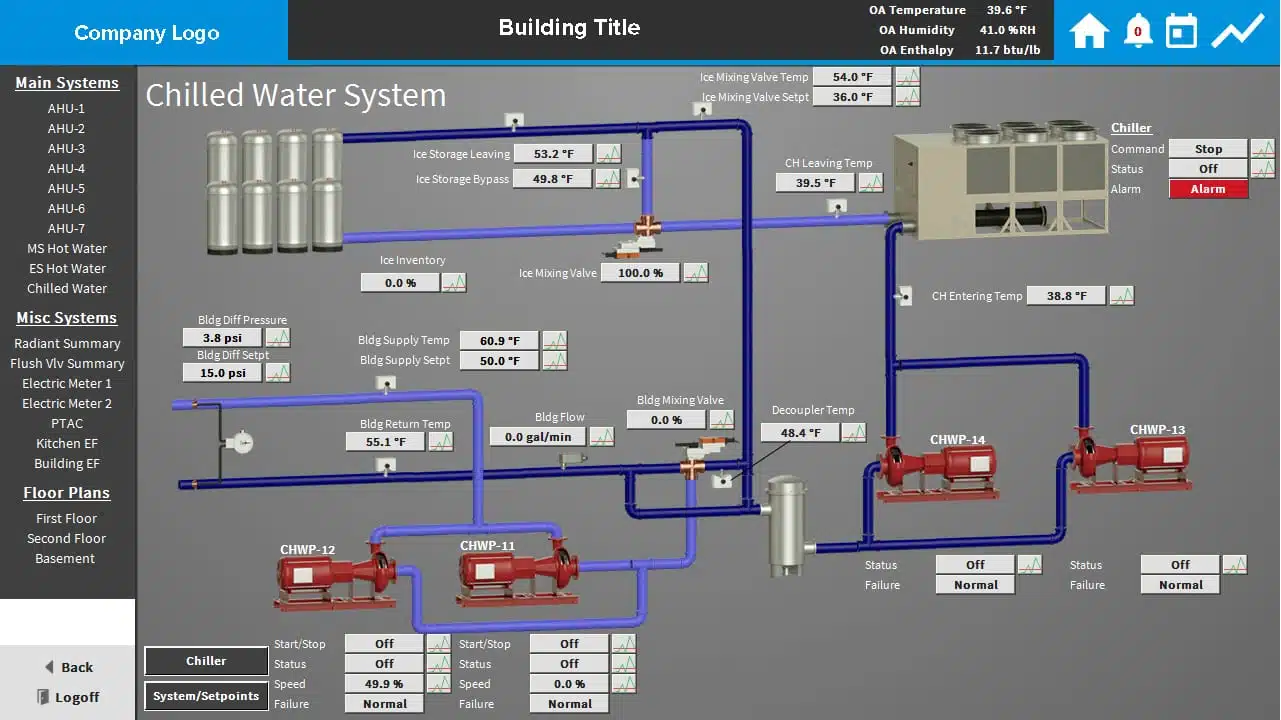
QA Graphics provides system graphic development for all versions of Niagara 4, including Niagara Reflow.

We can develop BAS graphics using the existing Niagara symbol libraries or provide custom BAS graphics solutions. QA Graphics enhanced symbol libraries both come with .jar files that have the ability to be seamlessly used inside of all Niagara software.

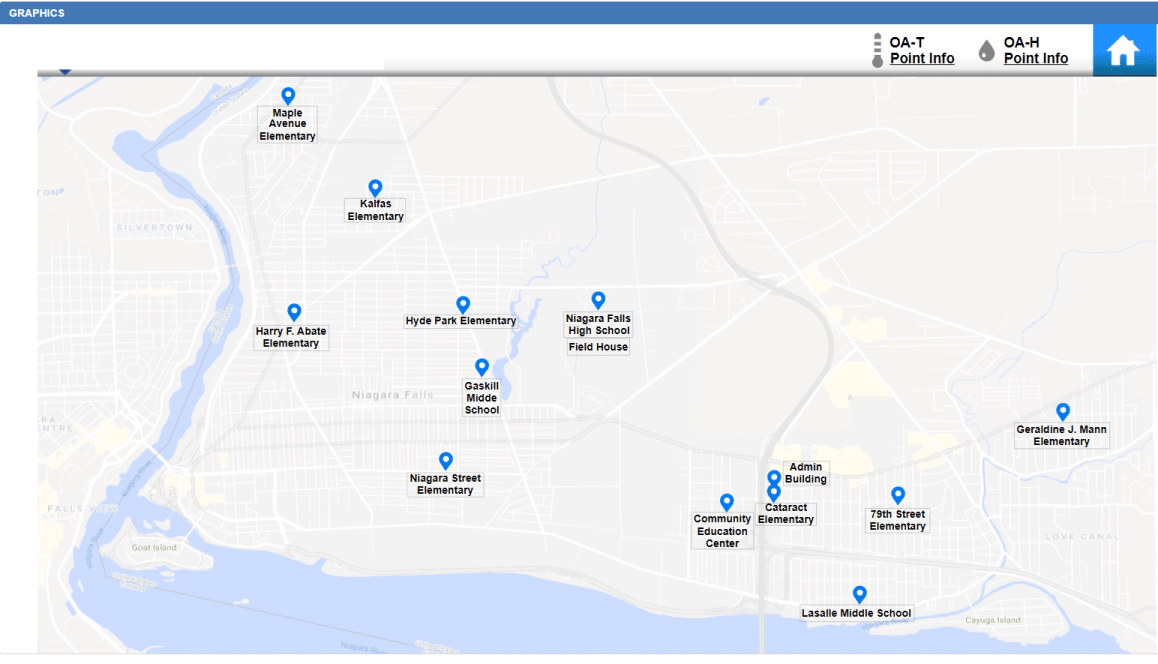
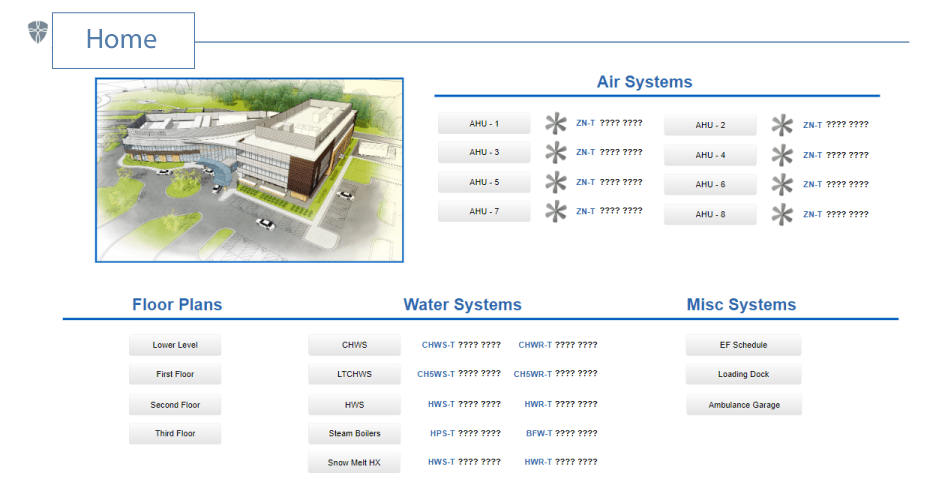
QA Graphics full turnkey solution includes all of the site’s equipment graphics, floor plans, navigation and point mapping. The work can be completed on a live station via VPN, or offline with a station backup.

Contact Us Today

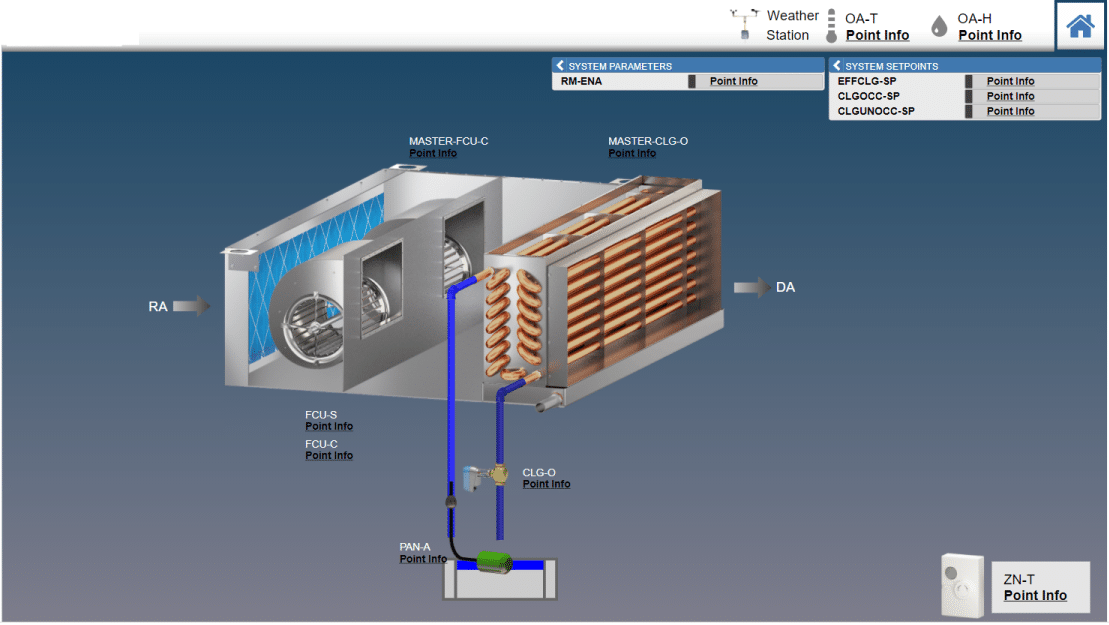
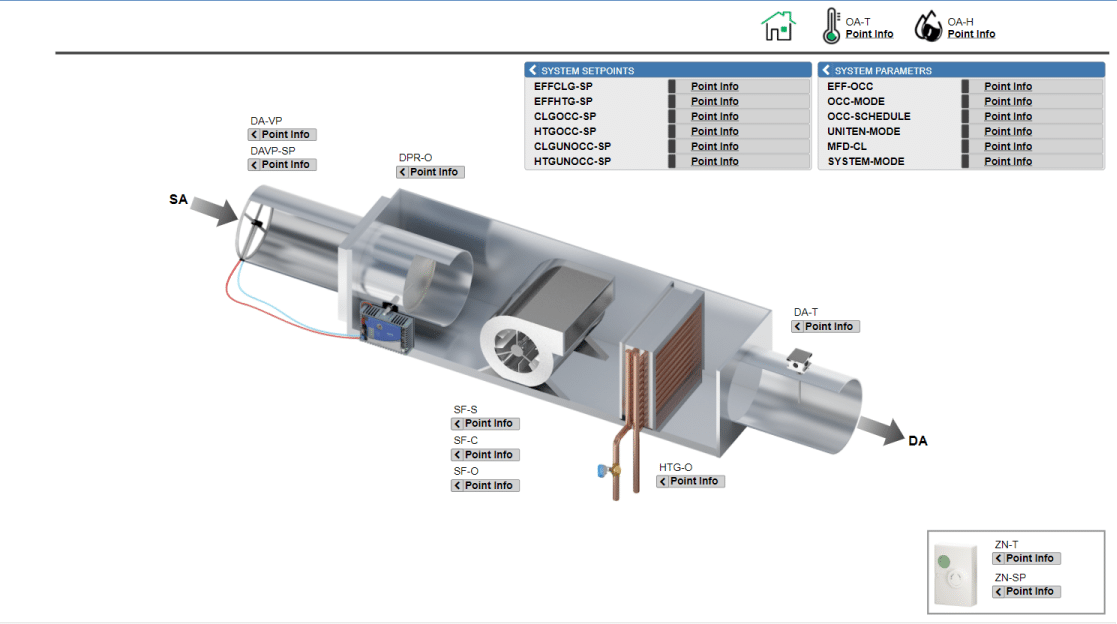
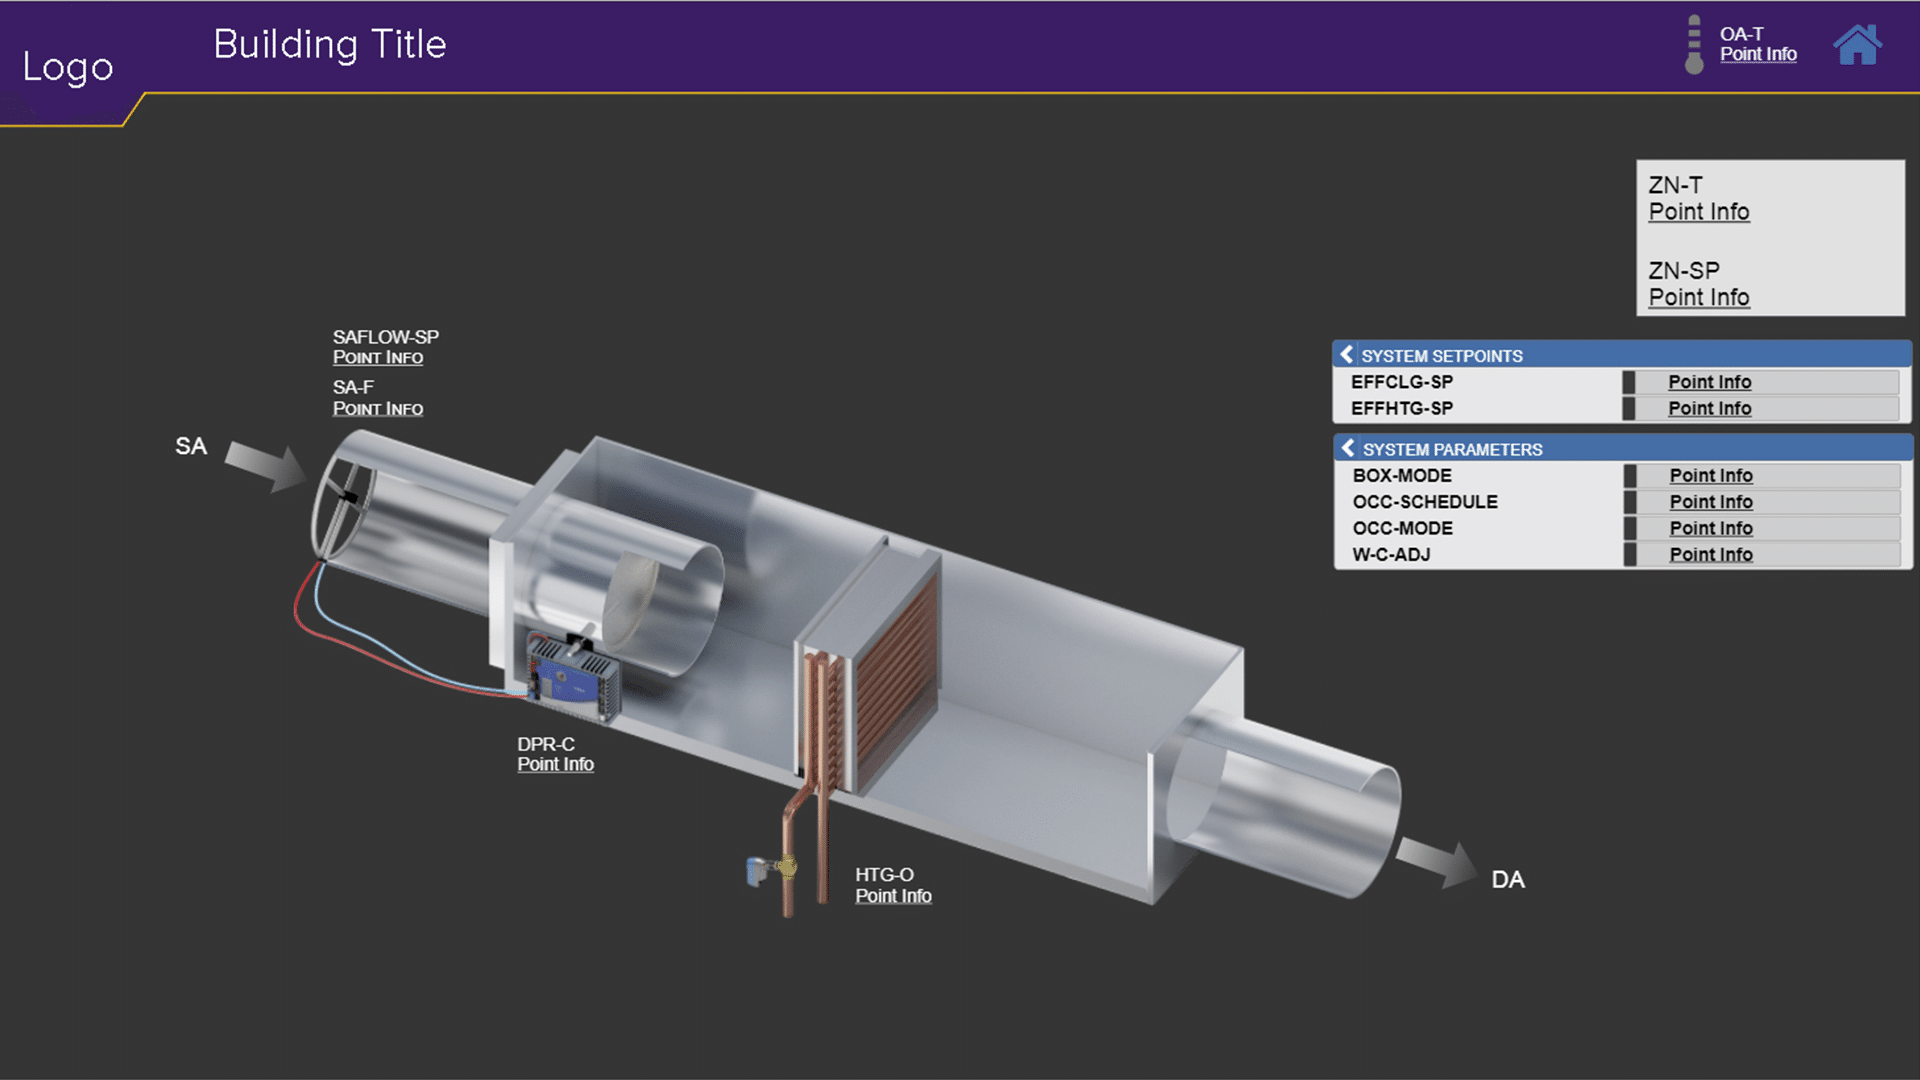
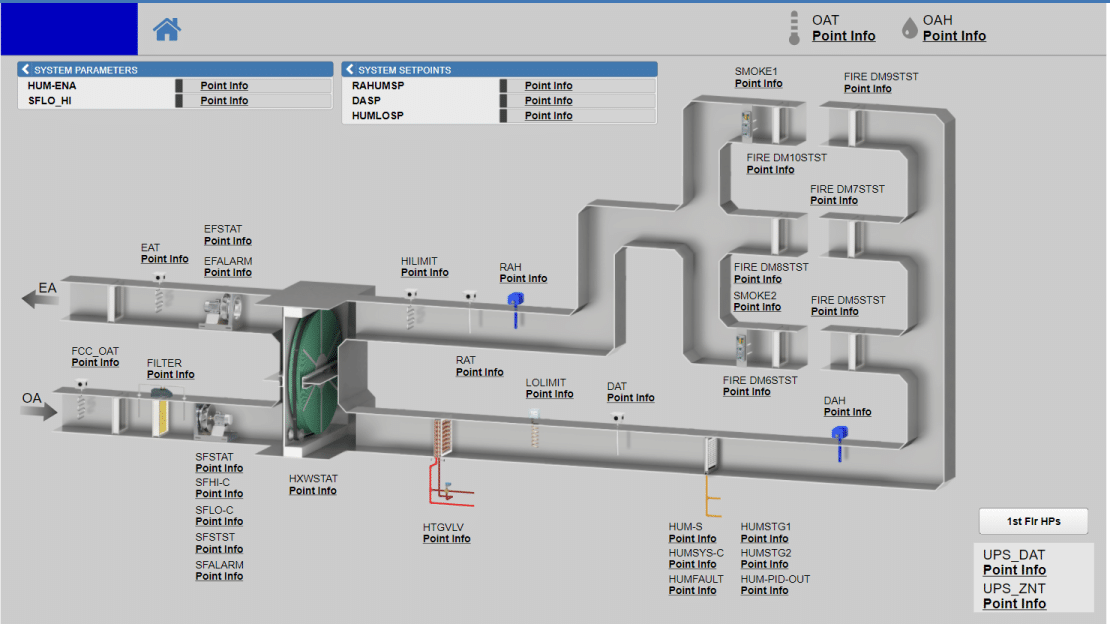
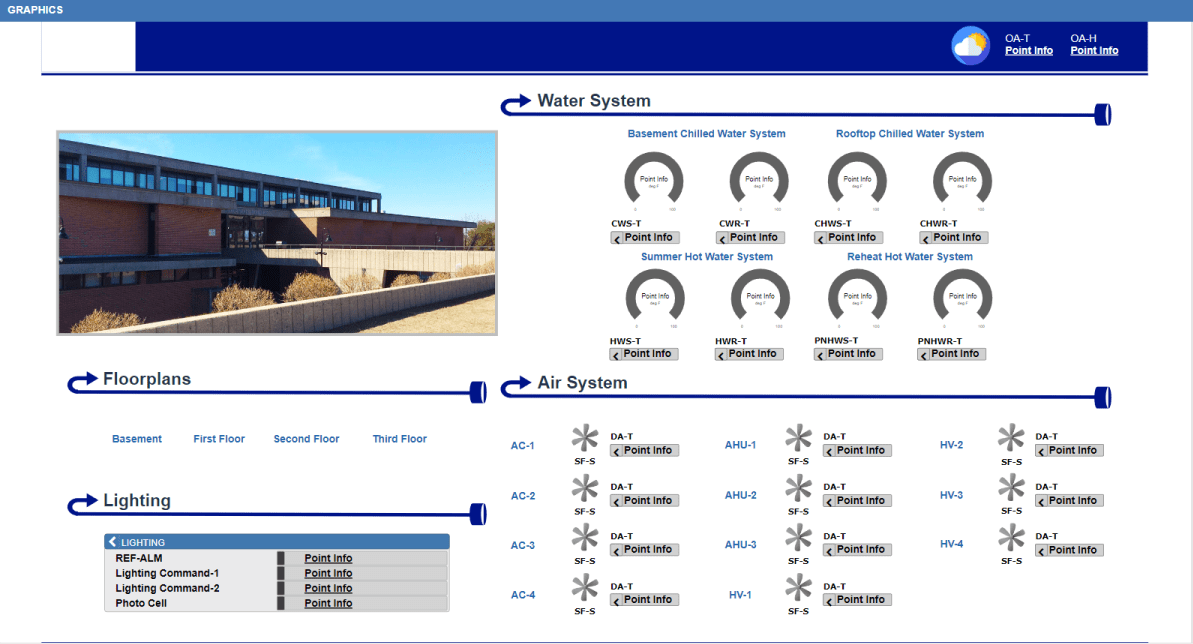
TRANE SYSTEM GRAPHICS

QA Graphics collaborates with Trane branches and system integrators nationwide.

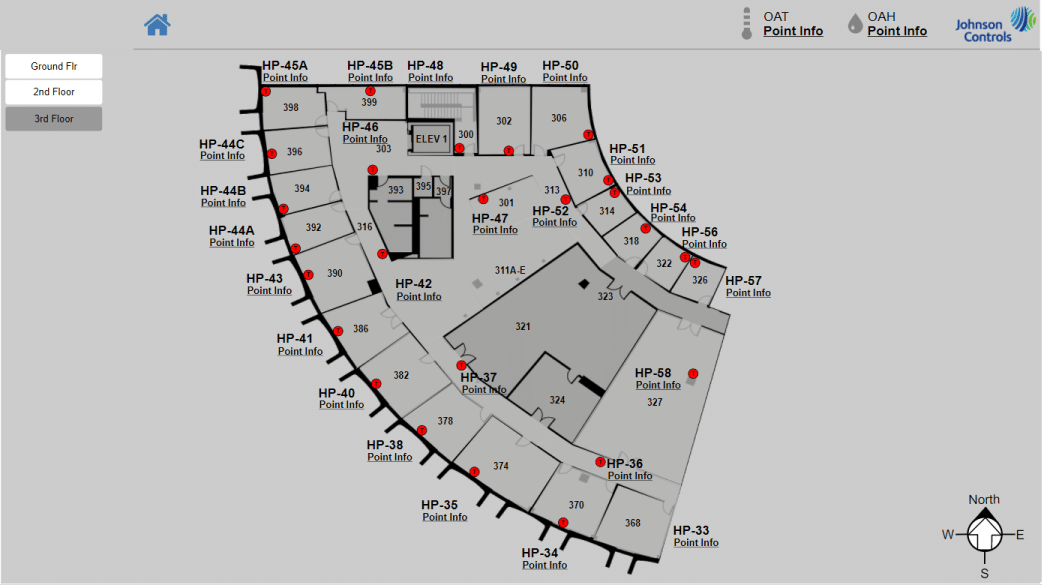
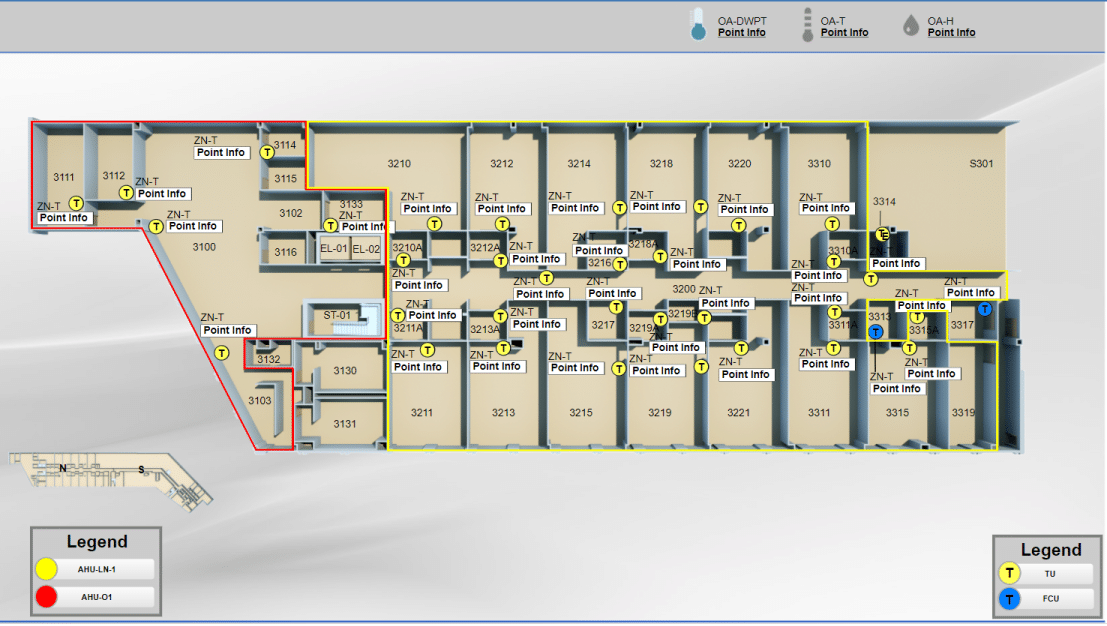
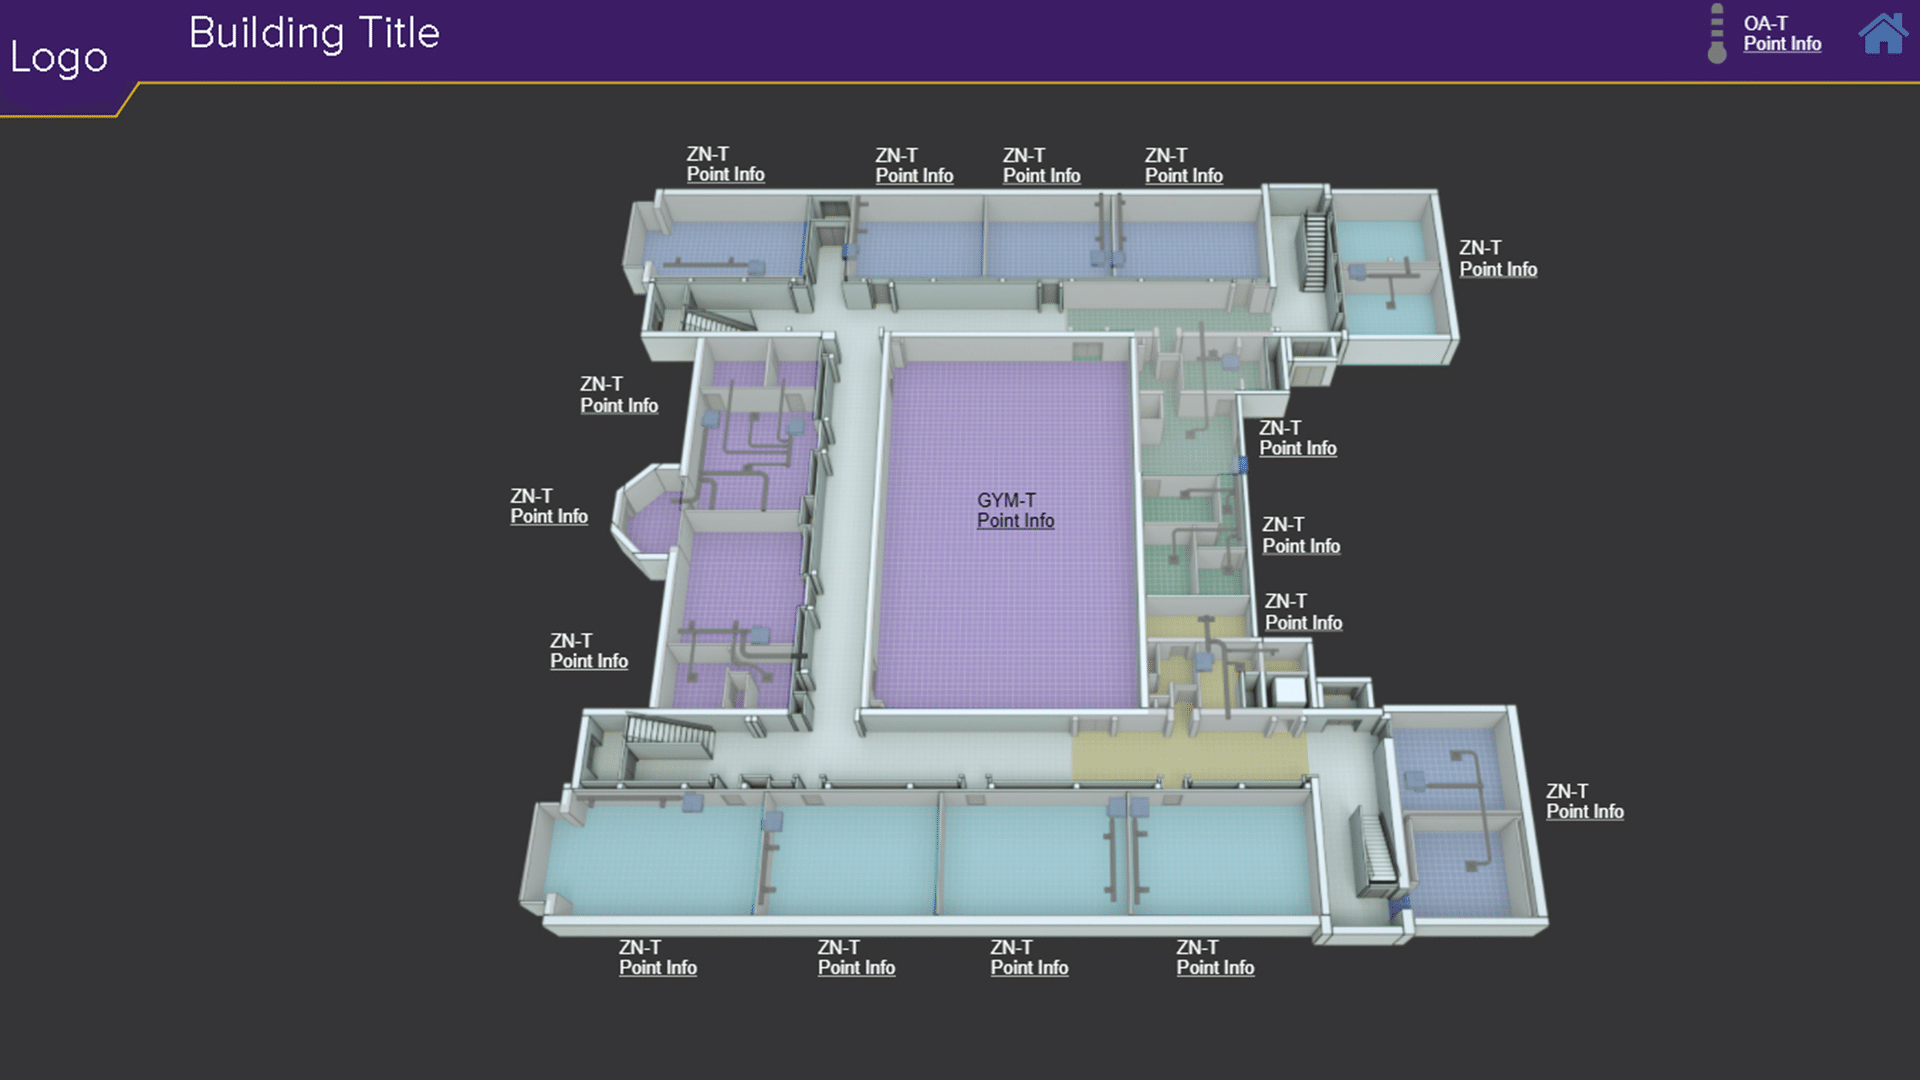
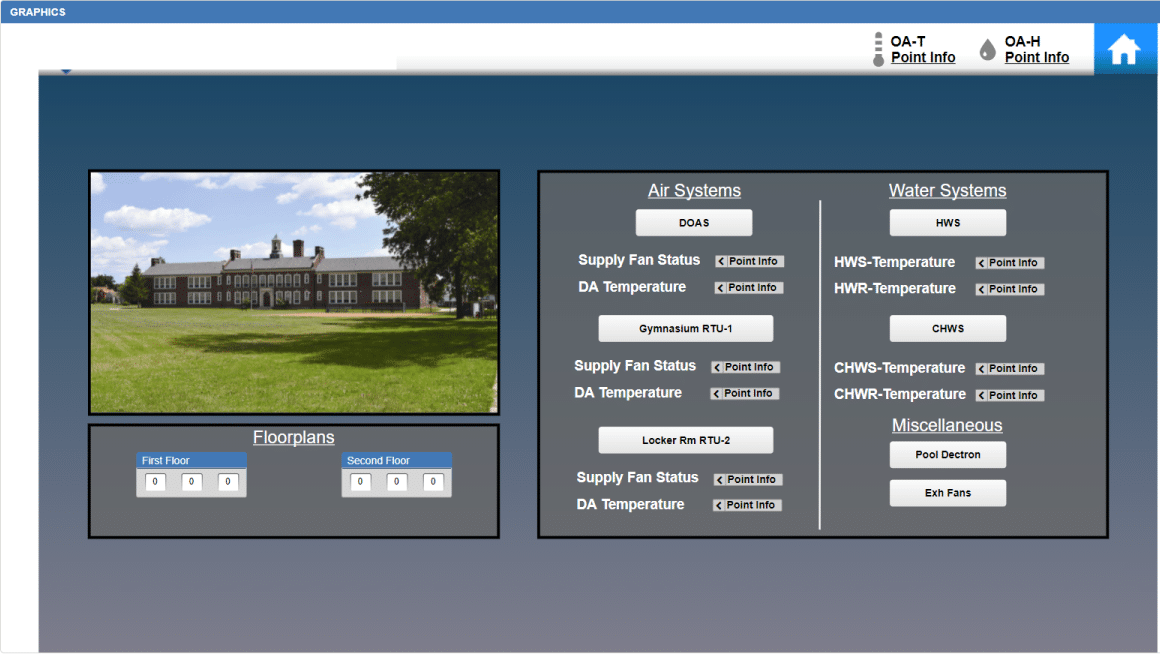
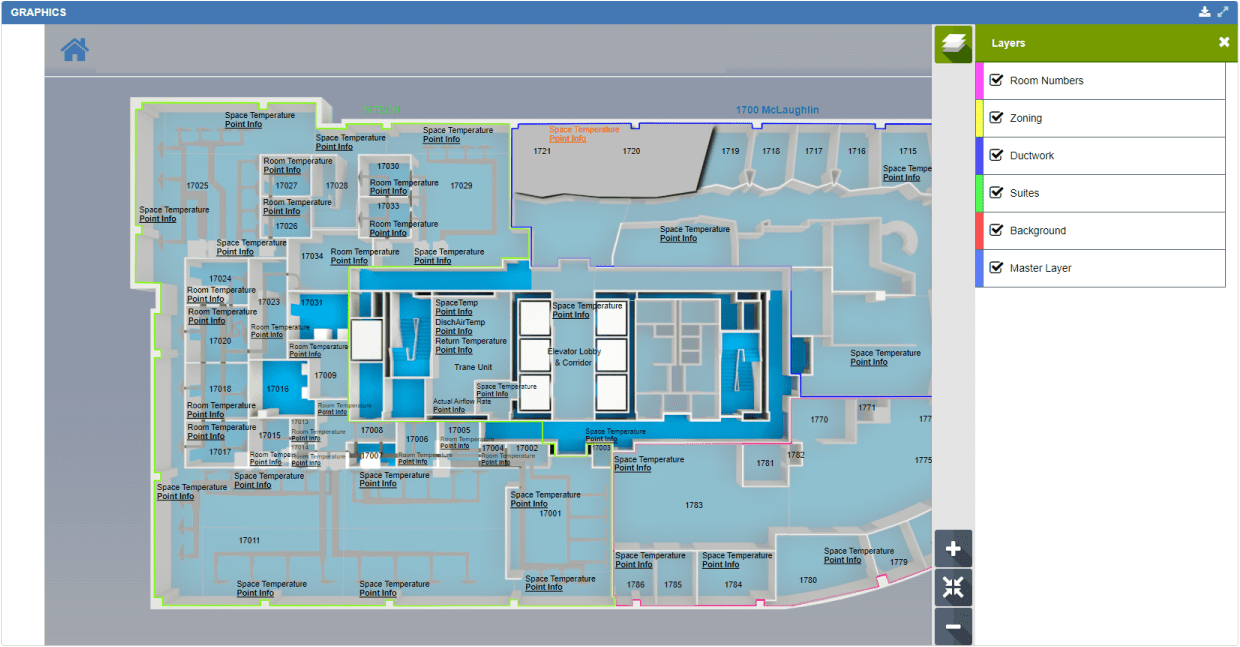
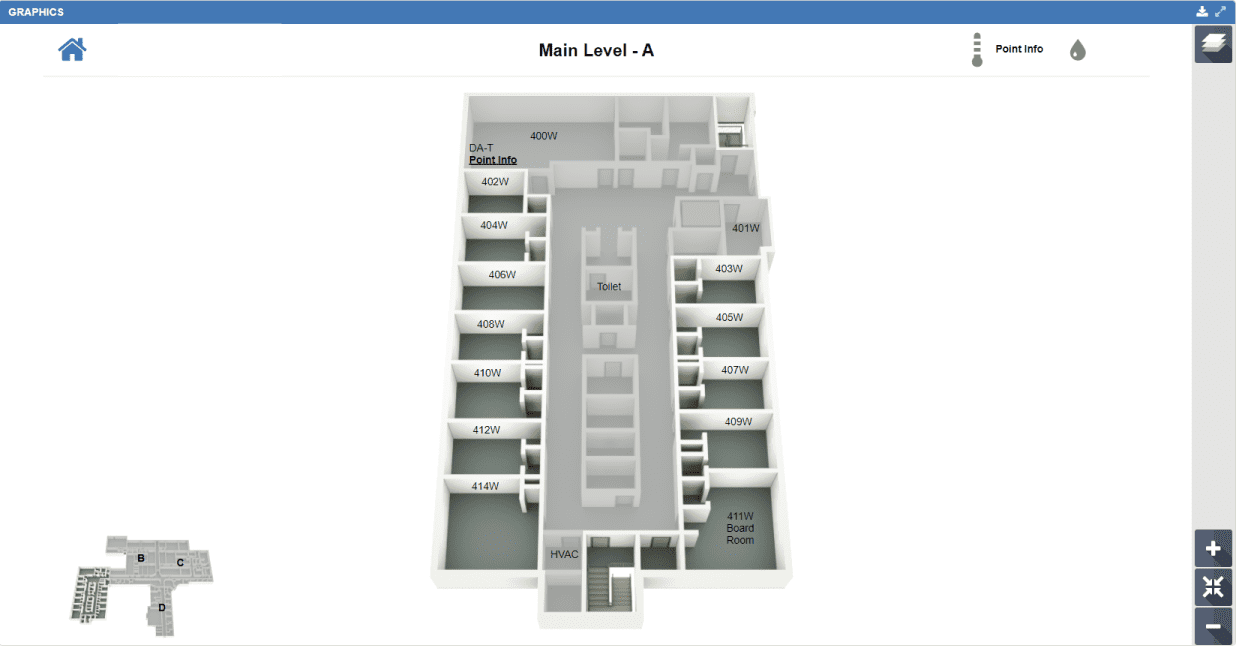
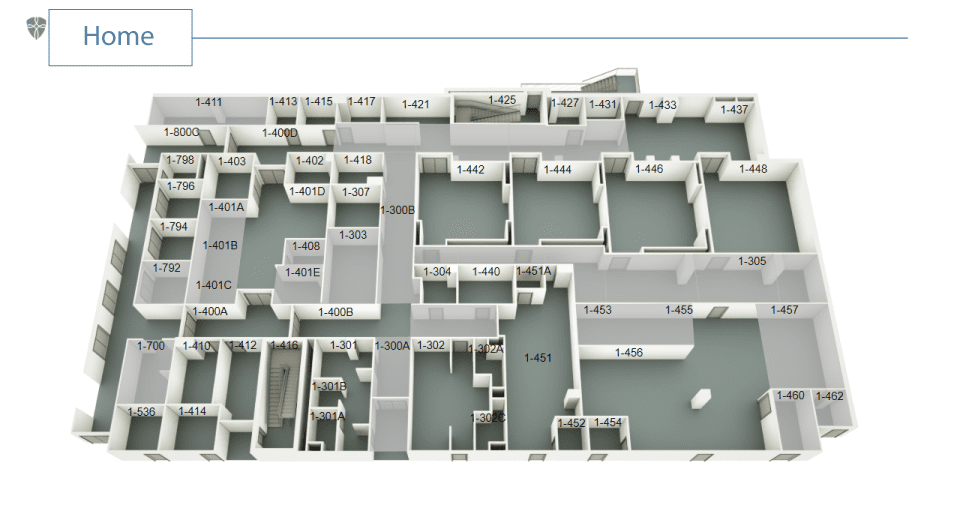
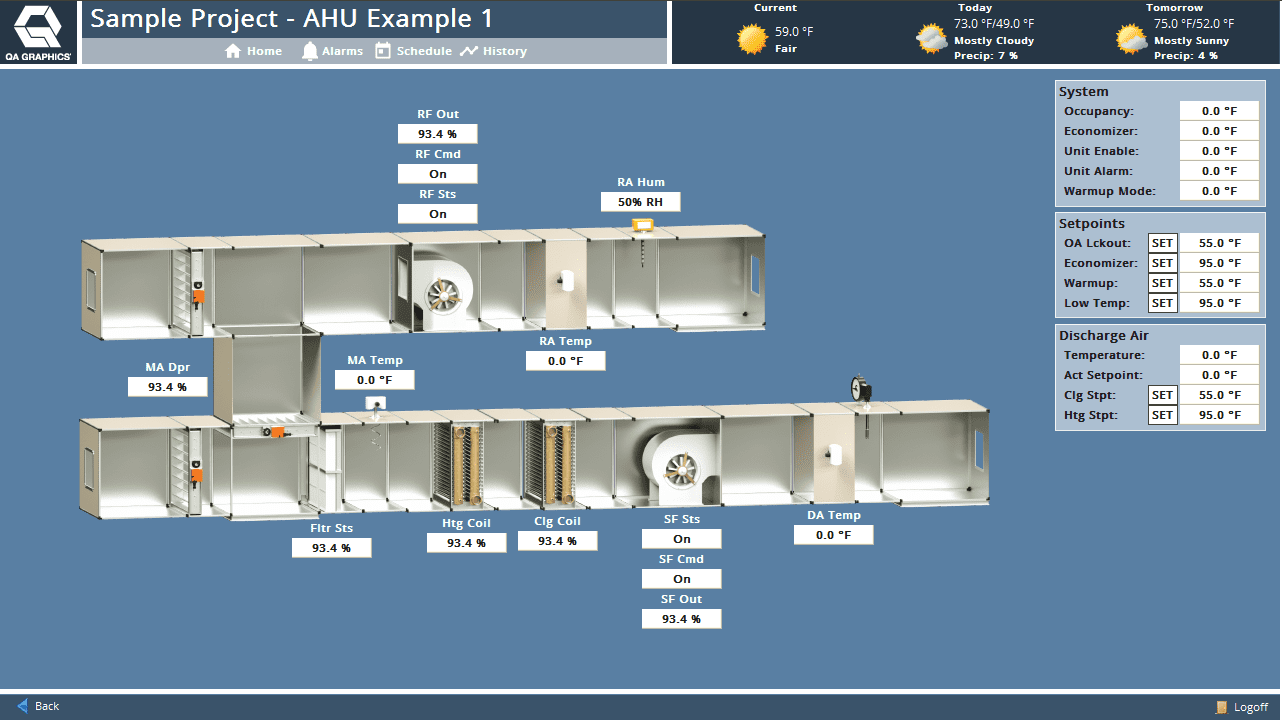
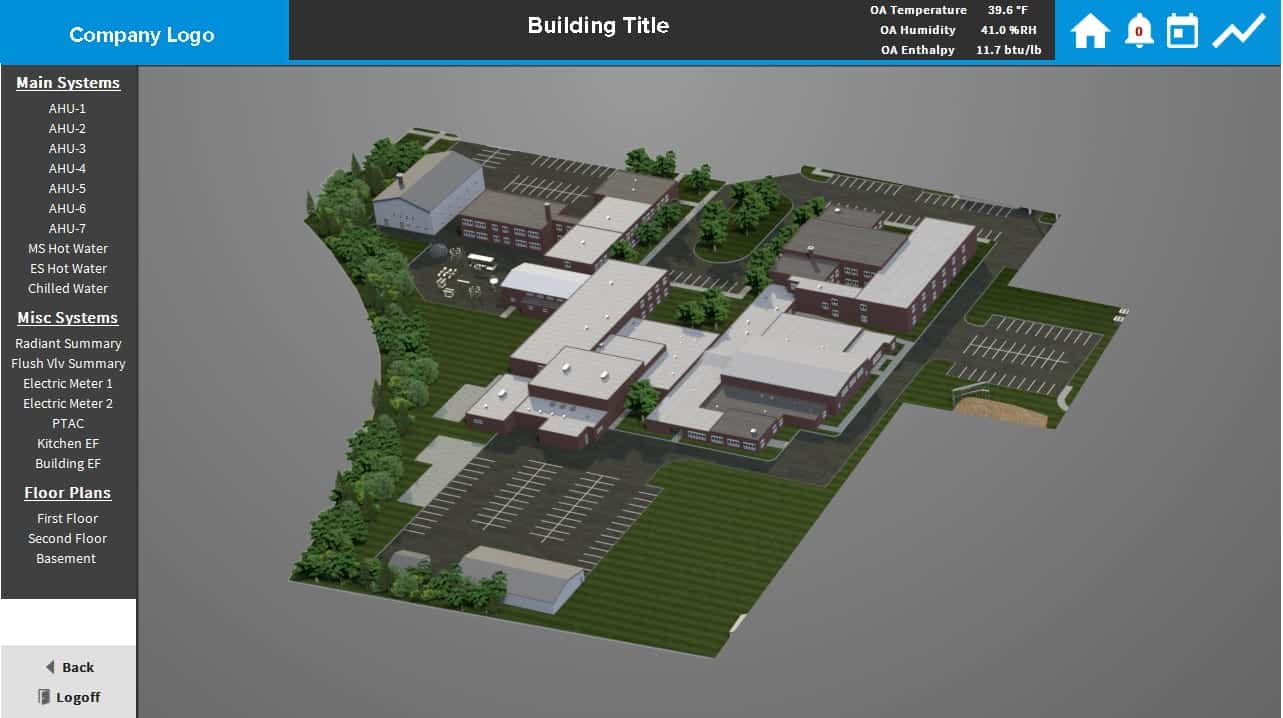
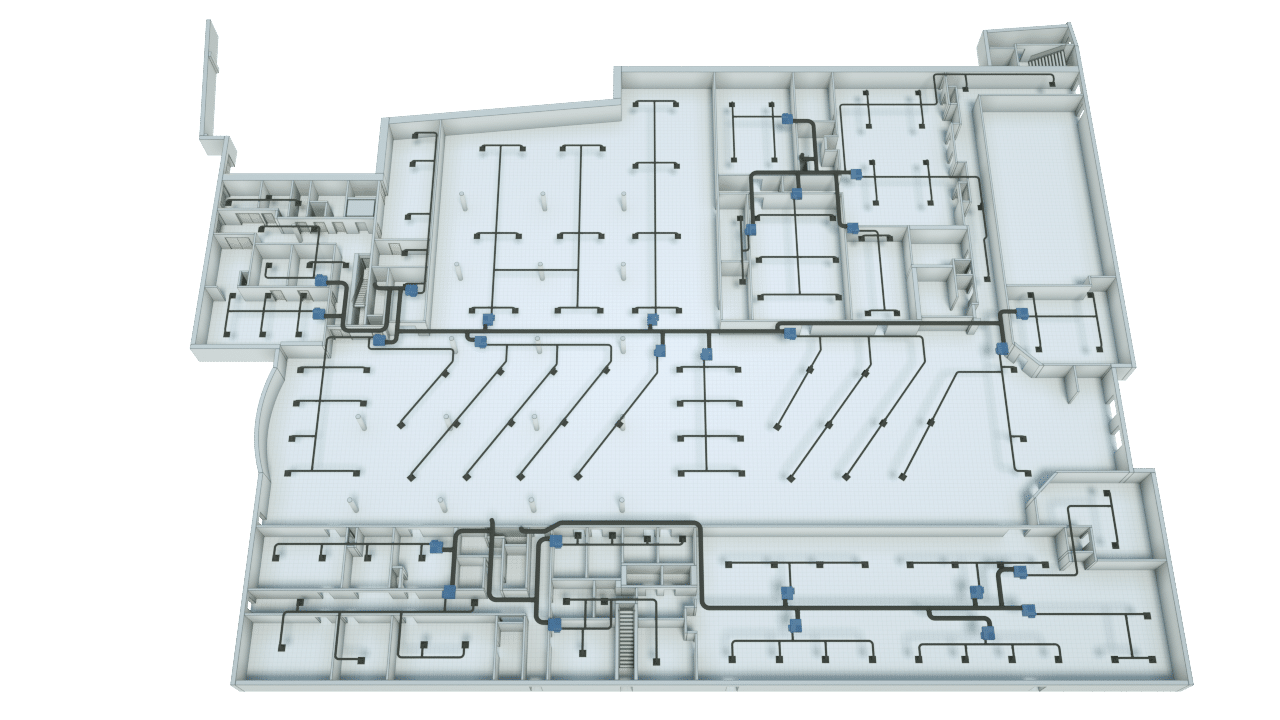
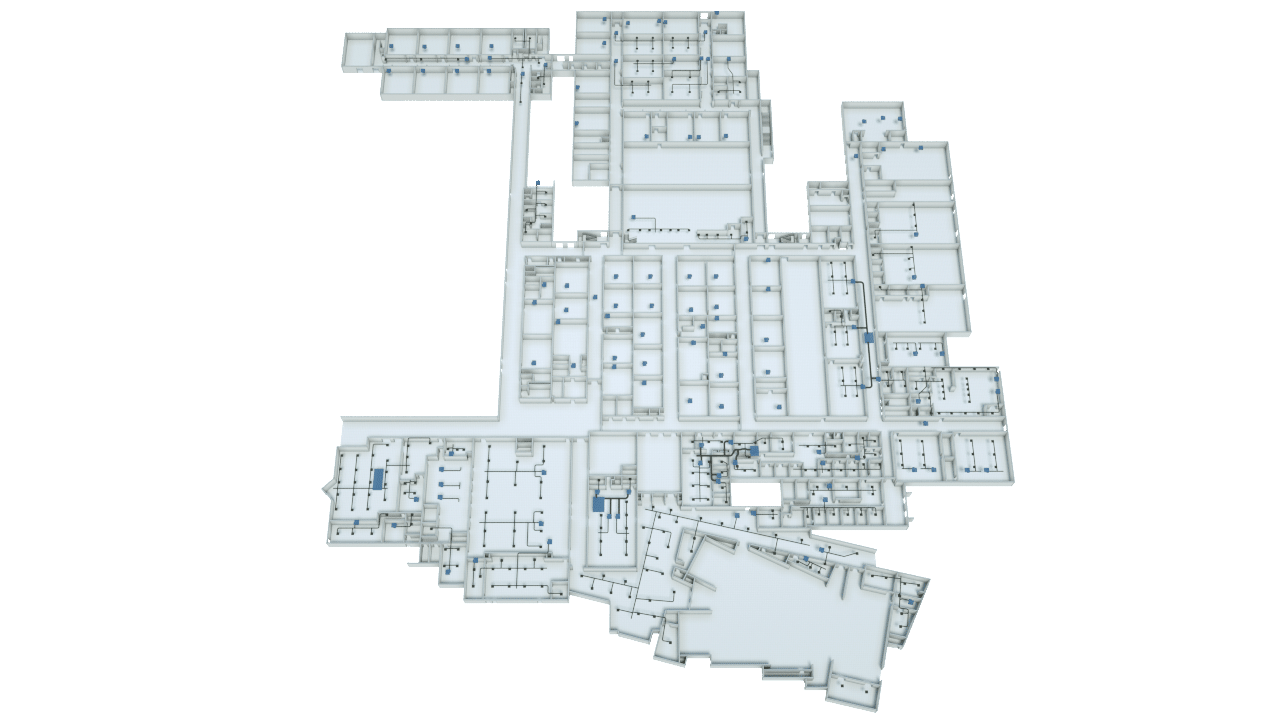
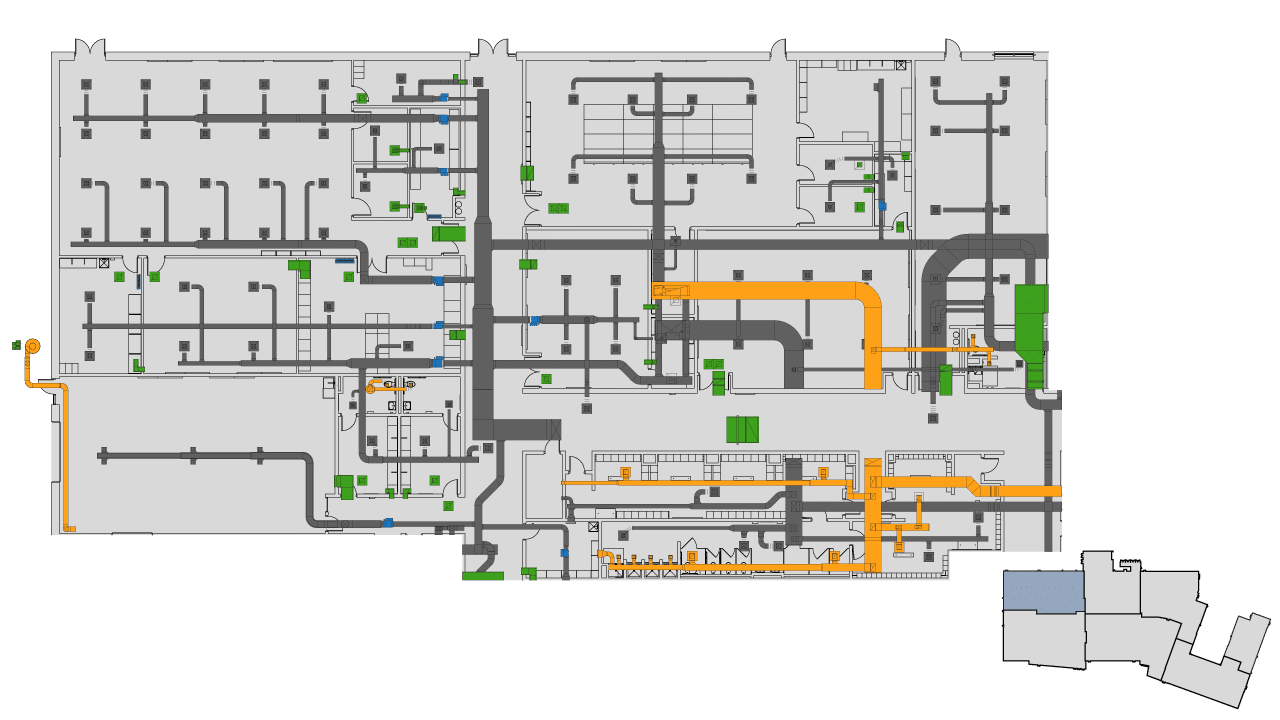
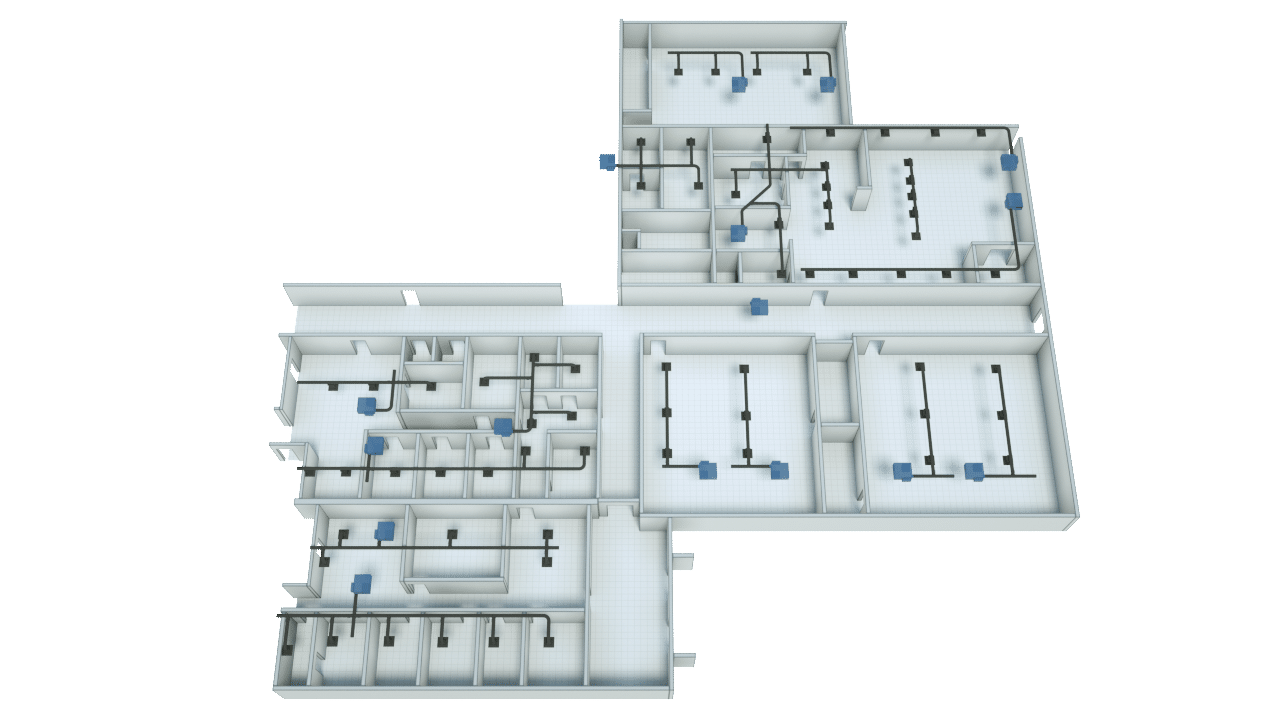
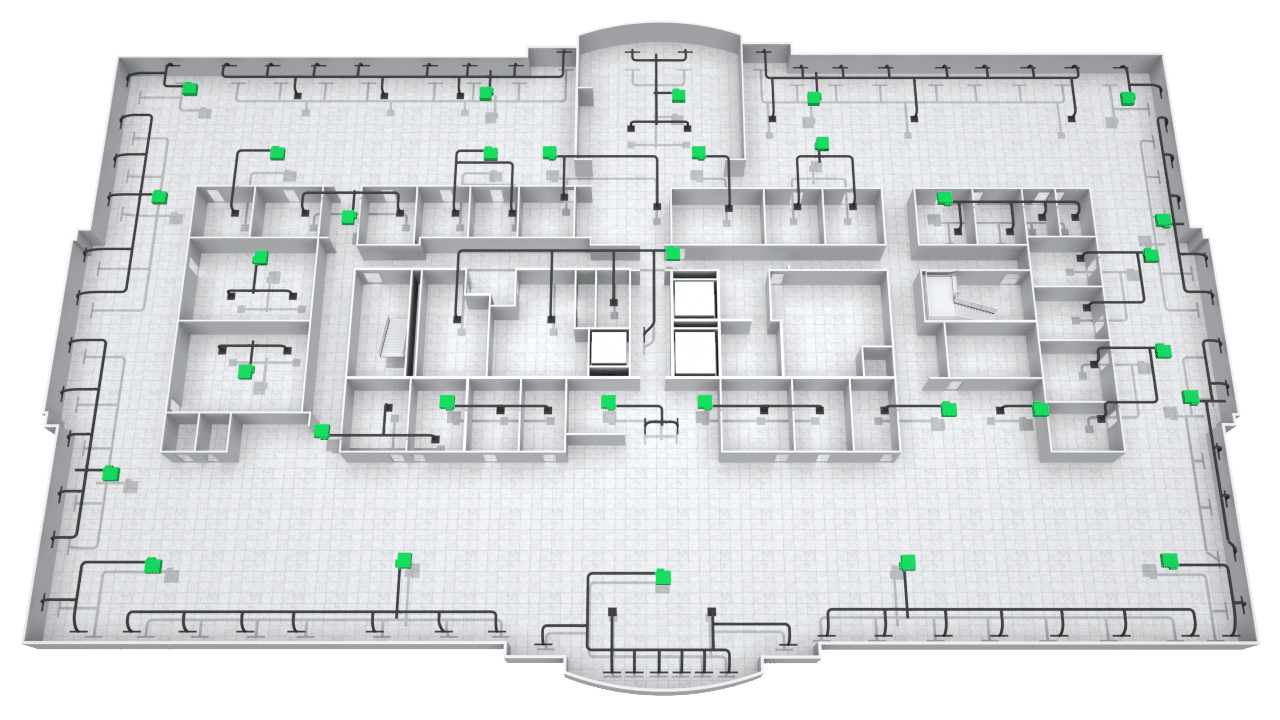
We create 2D and 3D floor plan graphics that align with Trane Corporate standards or provide custom floor plans tailored to your end-users’ needs.

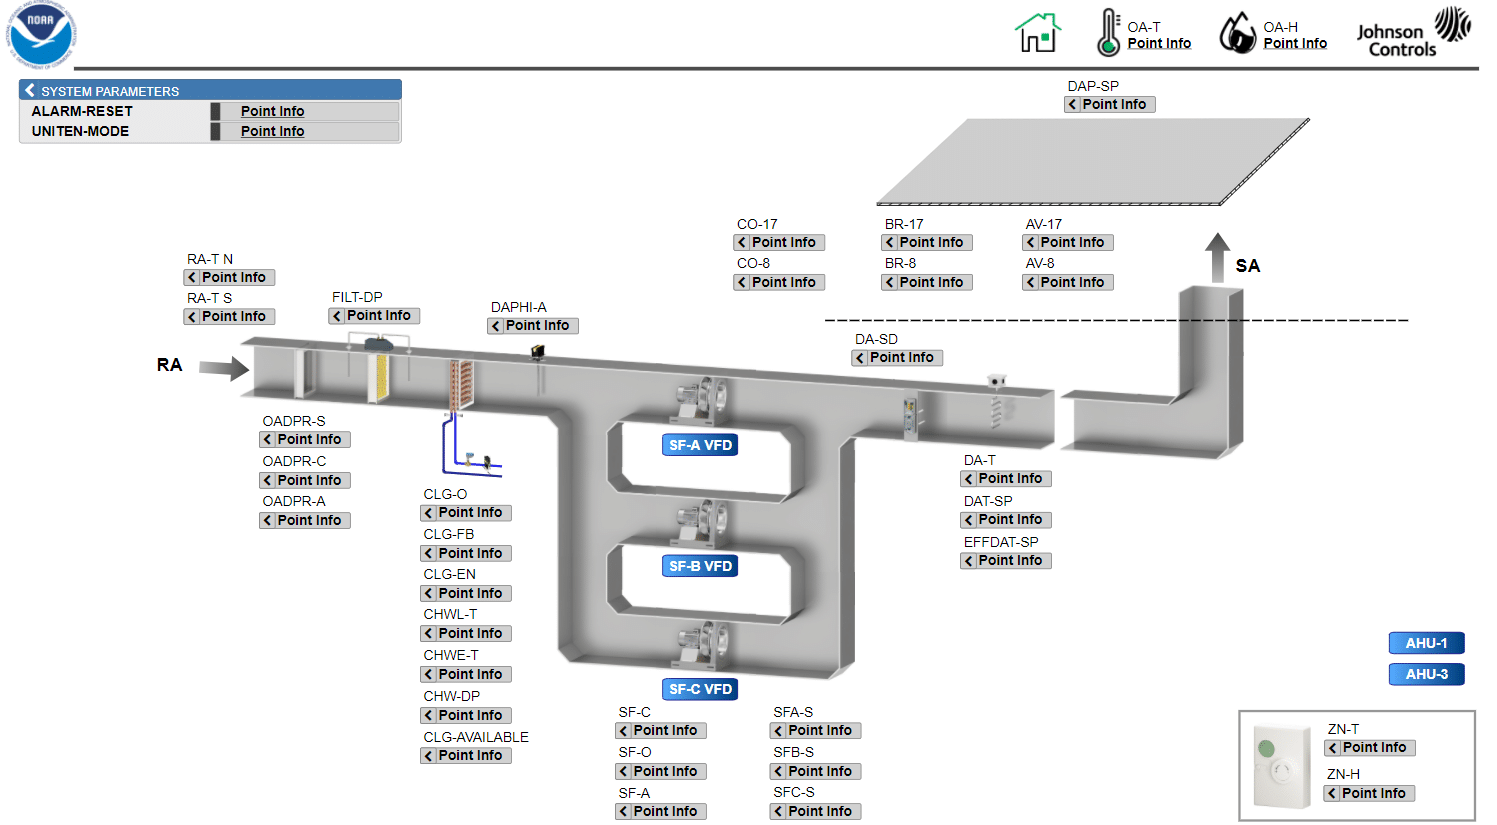
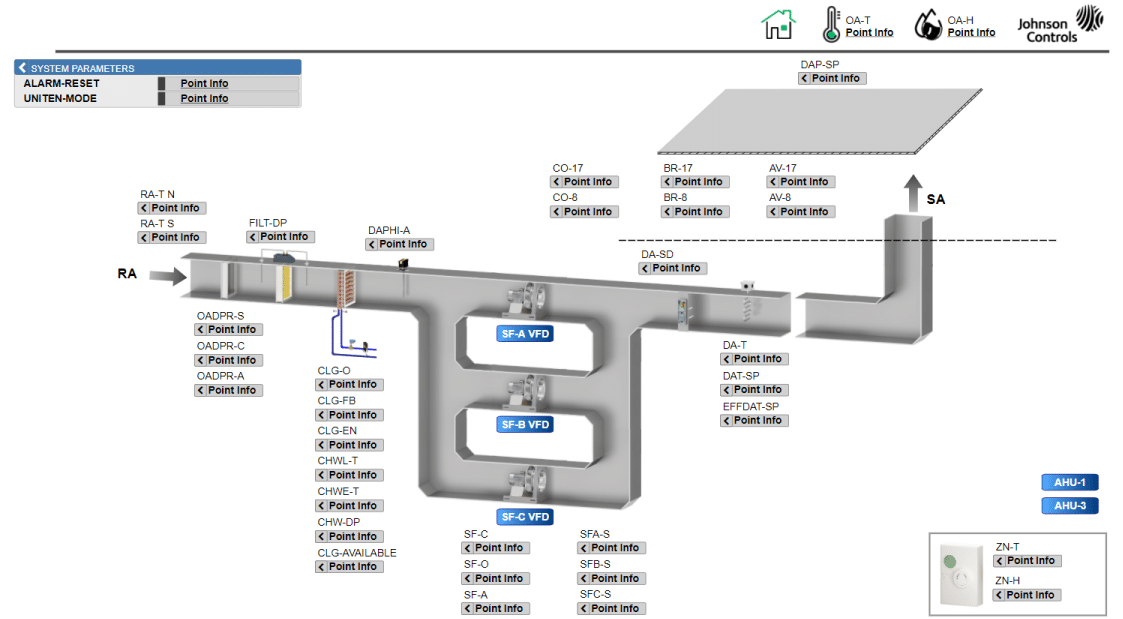
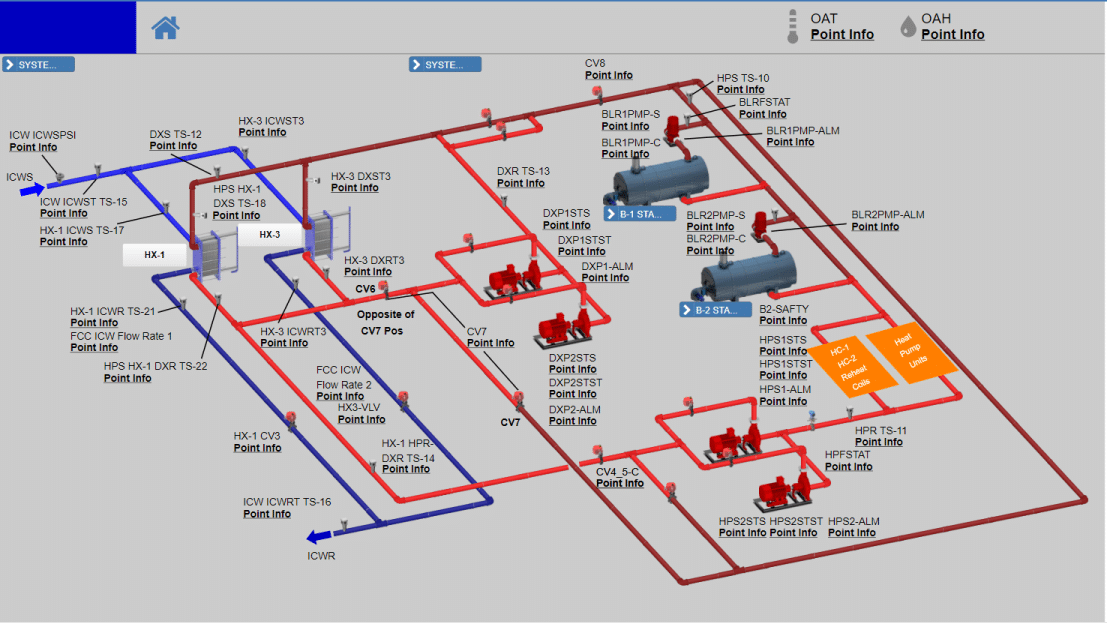
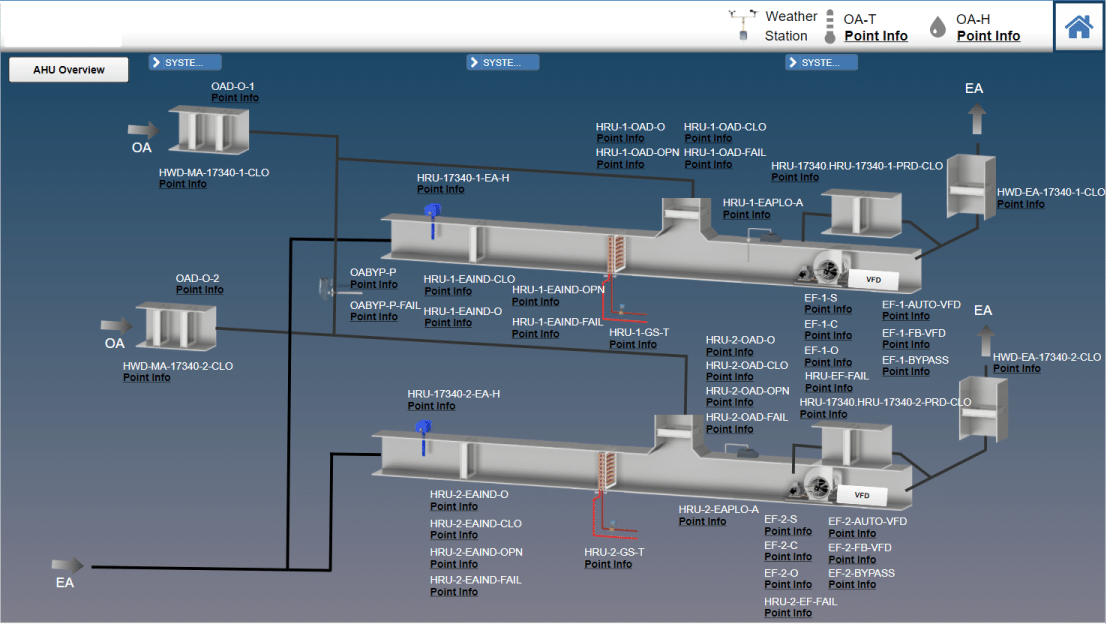
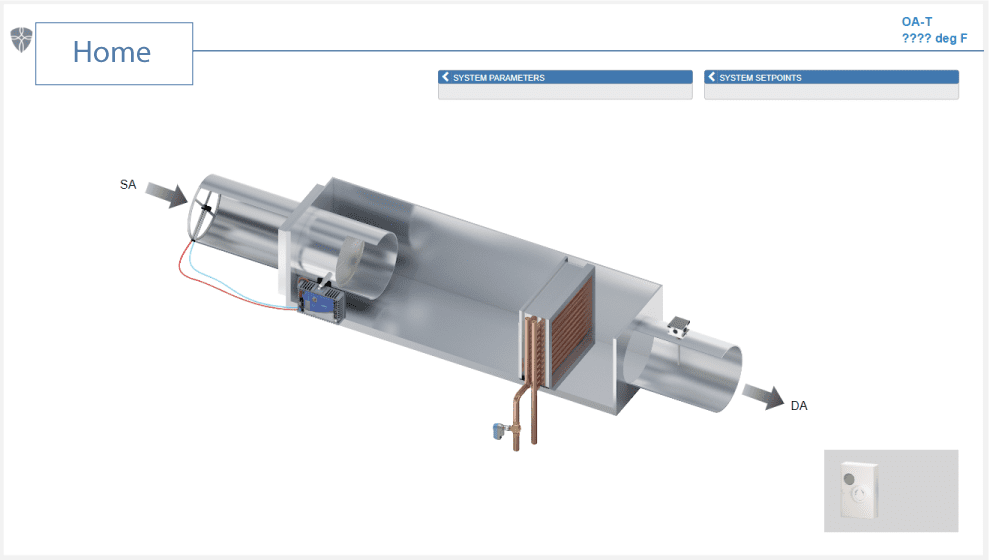
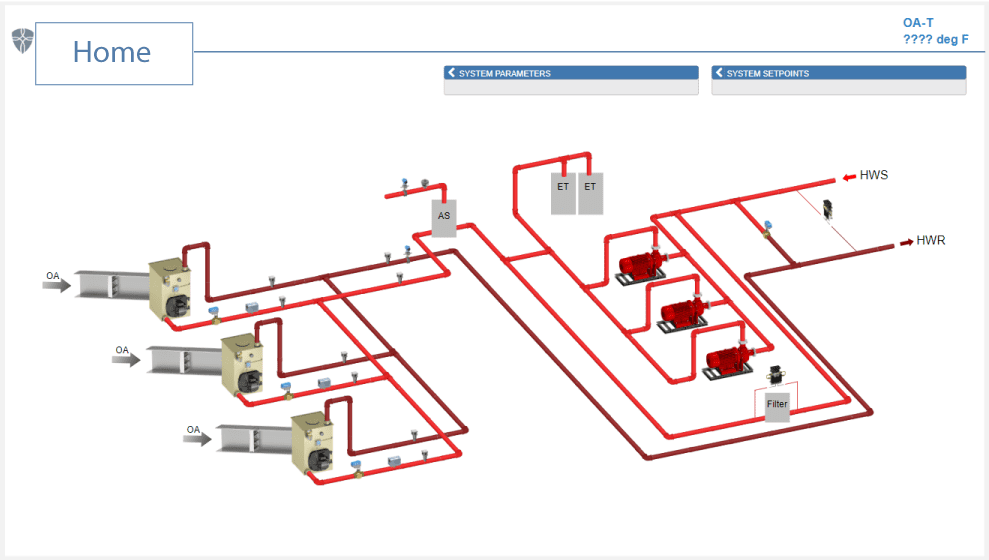
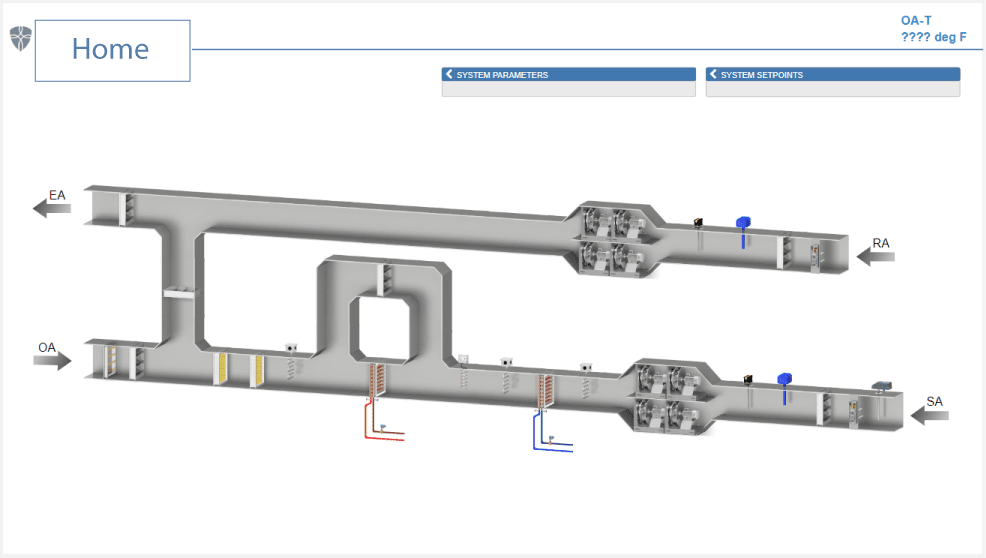
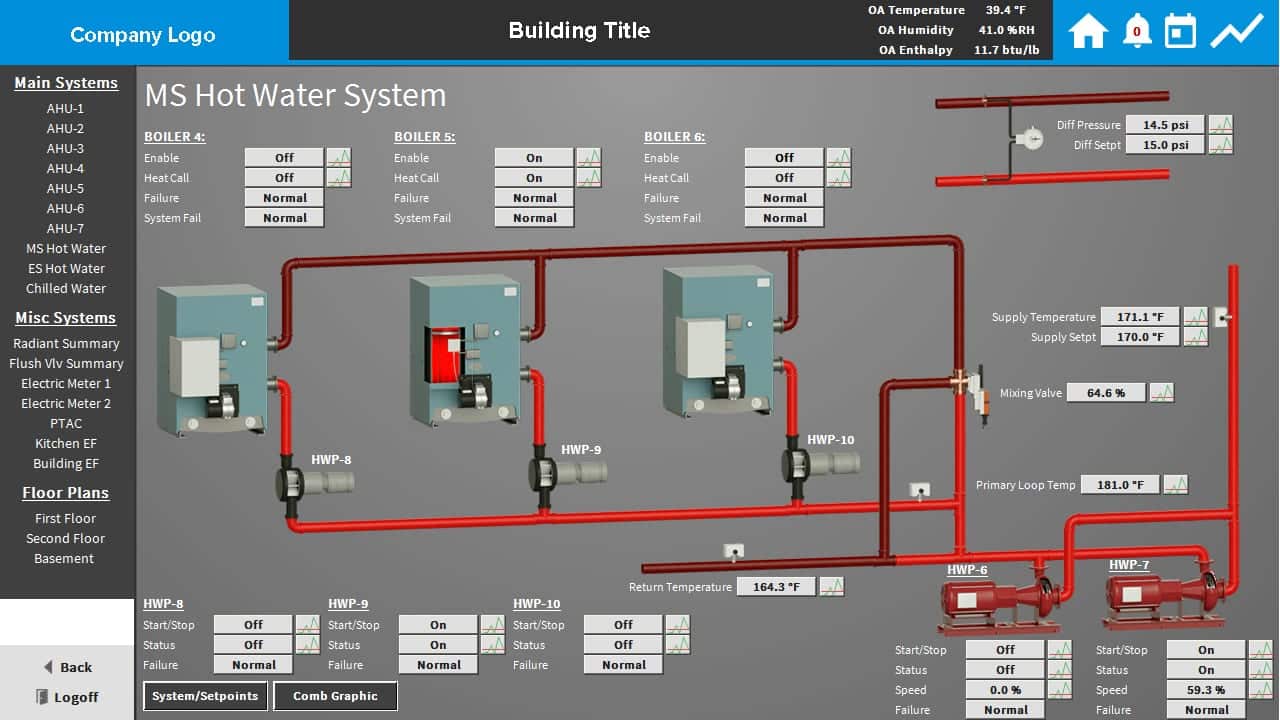
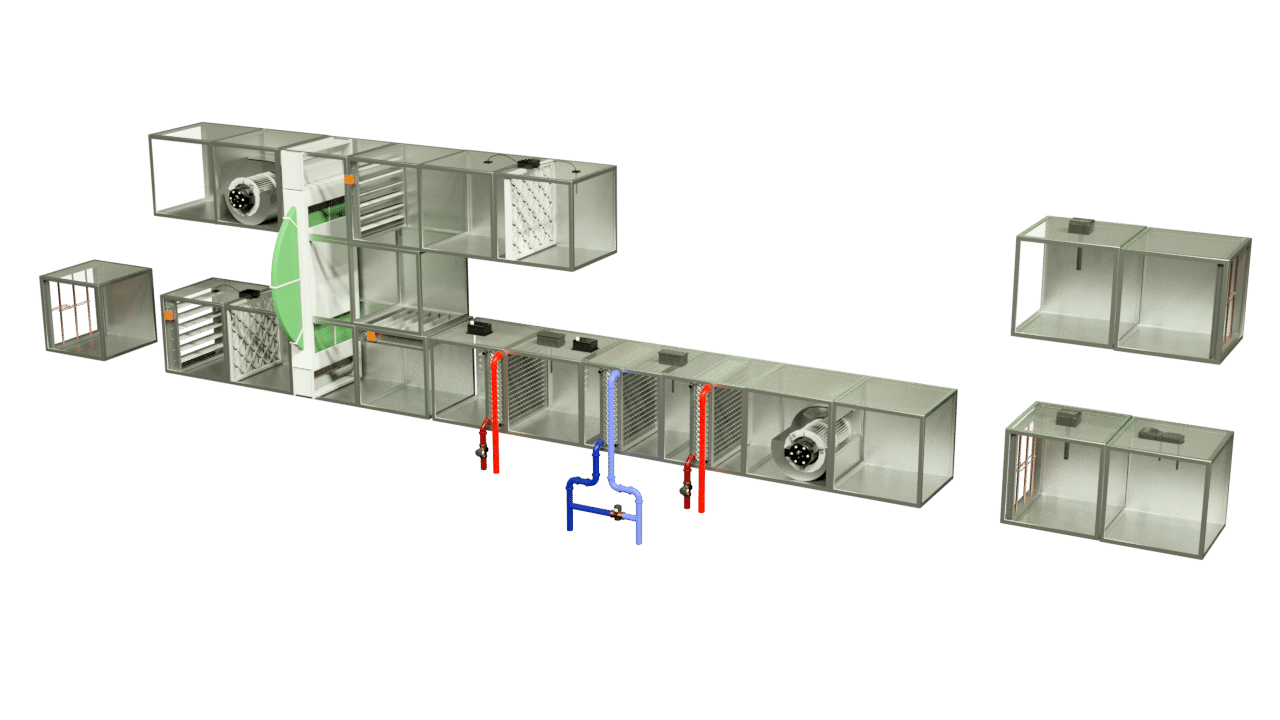
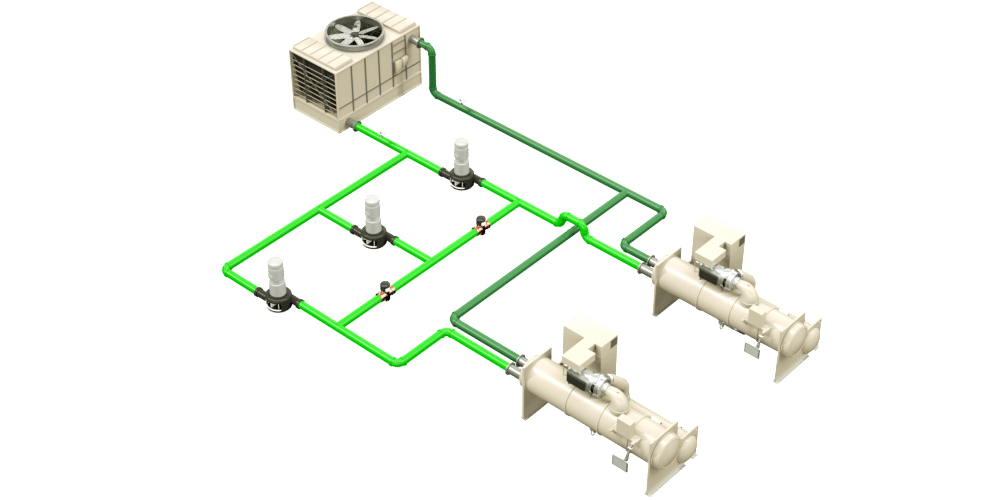
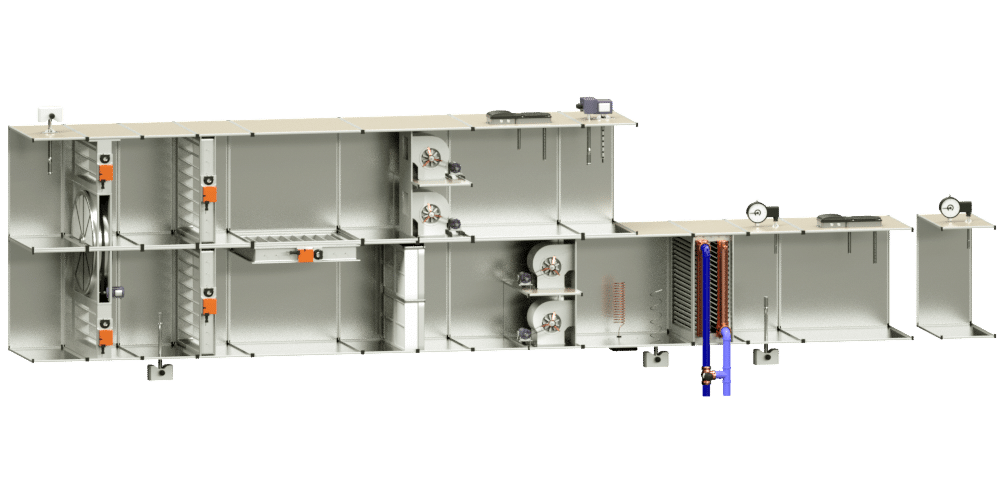
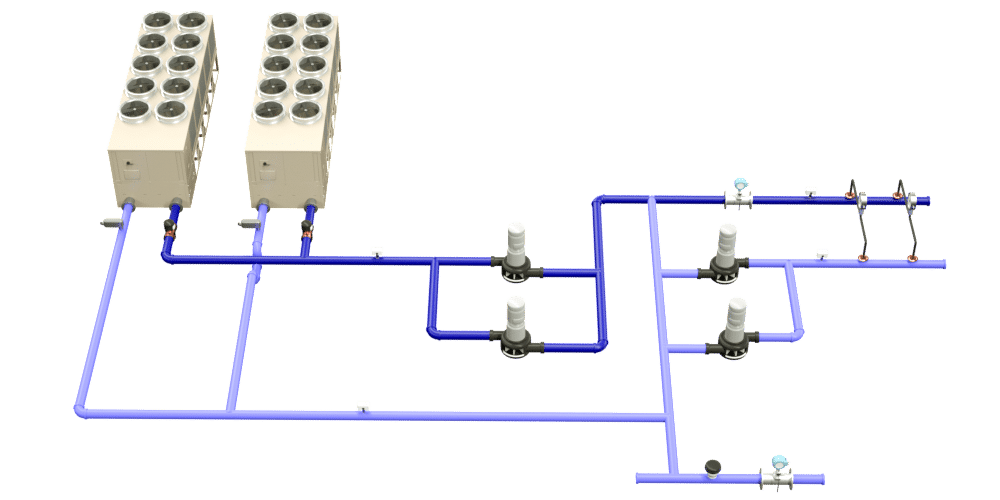
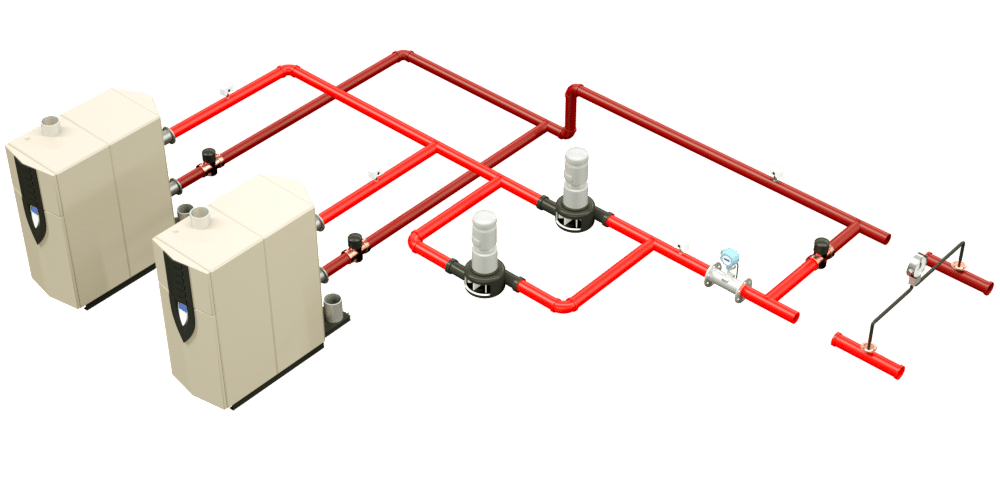
Additionally, QA Graphics offers custom flow system graphics and realistic 3D equipment renderings compatible with all versions of Trane graphic software.

Contact Us Today
3D floor plan of a building with multiple rooms and corridors, featuring black pipelines and blue valves or junctions running throughout the structure. The layout appears complex and industrial.
A detailed architectural floor plan of a large building, showing multiple rooms, corridors, and entrances arranged in an irregular, complex layout on a white background.
Floor plan of a large building with multiple rooms, corridors, and pathways marked in black, orange, blue, and green; a small highlighted zone on an inset map appears in the bottom right corner.
3D floor plan of a building with multiple rooms, hallways, and blue square markers indicating specific points in various areas. The layout shows separate sections, possibly offices, meeting rooms, and corridors.
A digital rendering of an air handling unit (AHU) system shows its internal components, including filters, fans, dampers, coils, ducts, and piping, all arranged in a modular, exploded view on a white background.
3D diagram of an HVAC chiller system with two chillers, four pumps, connecting green pipes, and a cooling tower unit, showing the flow and connections between components on a light background.
Cutaway view of an air handling unit showing internal components, including fans, filters, dampers, control panels, and piping for heating or cooling, all inside a large metal casing.
Diagram showing a network of blue and white pipes connected to several rectangular and cylindrical units, likely representing an HVAC or plumbing system with various valves and connections.
3D diagram of a hydronic heating system with two boilers, red piping, valves, and pumps, illustrating the flow of heated water through various system components.
3D floor plan of a building with multiple rooms and hallways. Green squares are placed throughout, possibly indicating sensors or devices installed at various locations inside and around the perimeter.
A man in a white shirt points at a computer screen displaying architectural plans while a woman in a pink sweater sits at the desk, looking at the monitors. The workspace has multiple monitors, drinks, and office supplies.

Team Qualifications

Our design team includes trained mechanical engineers that can create system graphics for almost all building automation systems including:

  • JCI: Metasys UI
  • JCI: Facility Explorer (FX)
  • JCI: Metasys GGT
  • Tridium: Niagara AX
  • Tridium: Niagara 4
  • Schneider: Struxureware
  • And many more

Our Customers

Siemens Global
Johnson Controls logo
tridium Logo
schneider electric Logo
  • Next Slide
  • Next Slide

The prompt service and professionalism that the team at QA Graphics consistently delivers has been unmatched by anyone.

DUSTIN CANIPE
Project Engineer
– Ingersoll Rand –

I am a visionary, and Hiring QA Graphics to complete the animation of my one million square foot indoor Motorsports facility was seamless. From the first face to face meeting to the completion of the final product.  They listened, executed and provided me an animation that shows my concept. Excellent quality.

Al Scheinpflug
Designer of MotorDome
– MotorDome Indoor MotorSports –

Ready to get started?

Call us at 515-965-3403 or send us a message

Copyright © 2025 QA Graphics

1520 NW Irvinedale Dr, Suite 105
Ankeny, IA 50023

(515) 965-3403

Privacy Policy | Refund Policy

US Federal Contractor Registration Verified Vendor 2017-2018

Inc. 5000 America's Fastest-Growing Private Companies

Scroll to Top
Facebook Twitter LinkedIn YouTube Instagram
Everify

This site uses cookies to improve your user experience. By continuing to browse the site, you are agreeing to our use of cookies.