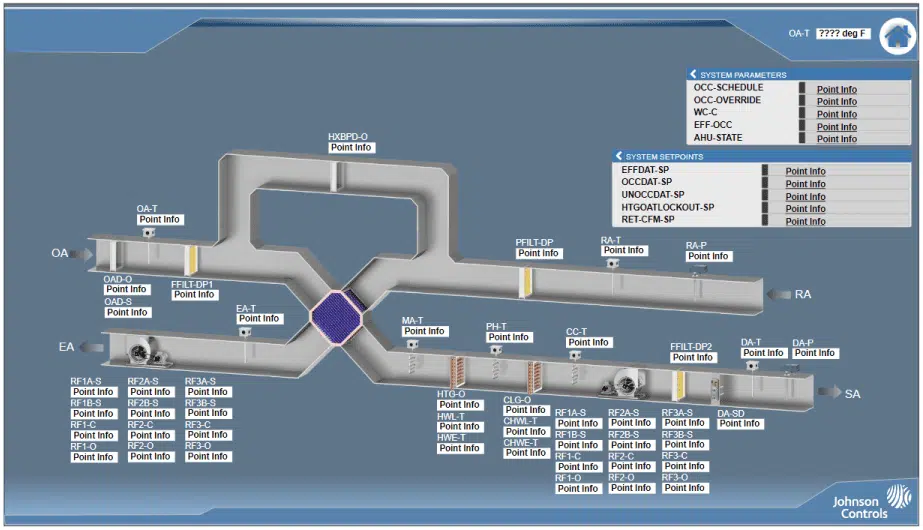
Originally, BAS graphics were rudimentary, primarily text-based. The graphical representation was confined to simple diagrams and charts, often shown on monochrome screens. User interaction was basic, predominantly through keyboard input and simple commands.
The Revolution of Graphical User Interfaces (GUIs)
The advent of graphical user interfaces (GUIs) revolutionized BAS graphics. With this innovation, graphics incorporating icons, symbols, and basic shapes to represent building elements became more prevalent. The introduction of color displays enhanced visual representation and user experience significantly. GUI software facilitated more intuitive navigation and interaction with building systems.
QA Graphics’ Impact on the Industry
QA Graphics entered the industry when BAS user interfaces were still lagging behind those in other sectors, such as process control software. One of our inaugural projects involved converting a large building control manufacturer’s symbol library. Their existing library, consisting of overly cartoonish symbols, was difficult to build within the software. Our team, which included 3D designers and a mechanical engineer, developed the new library from the ground up. The end product was a tremendous success for the customer, ushering their UI into a new era of graphics within the industry.
Advancements in 3D Graphics and BIM Integration
The emergence of advanced 3D graphics has provided more realistic representations of building layouts and systems. Integration with Building Information Modeling (BIM) software has enabled the creation of detailed, accurate building models for visualization purposes. Standardization of touchscreen interfaces has made interaction and control more intuitive. Meanwhile, the rise of customization options allows users to tailor graphics to their specific needs and preferences.
Expanding Accessibility and Improving Data Visualization
The integration with mobile devices and cloud-based platforms has broadened accessibility, enabling remote monitoring and control of building systems from anywhere. The implementation of data visualization techniques, such as graphs, charts, and dashboards, has enhanced data analysis and decision-making capabilities.
QA Graphics’ Continued Innovation
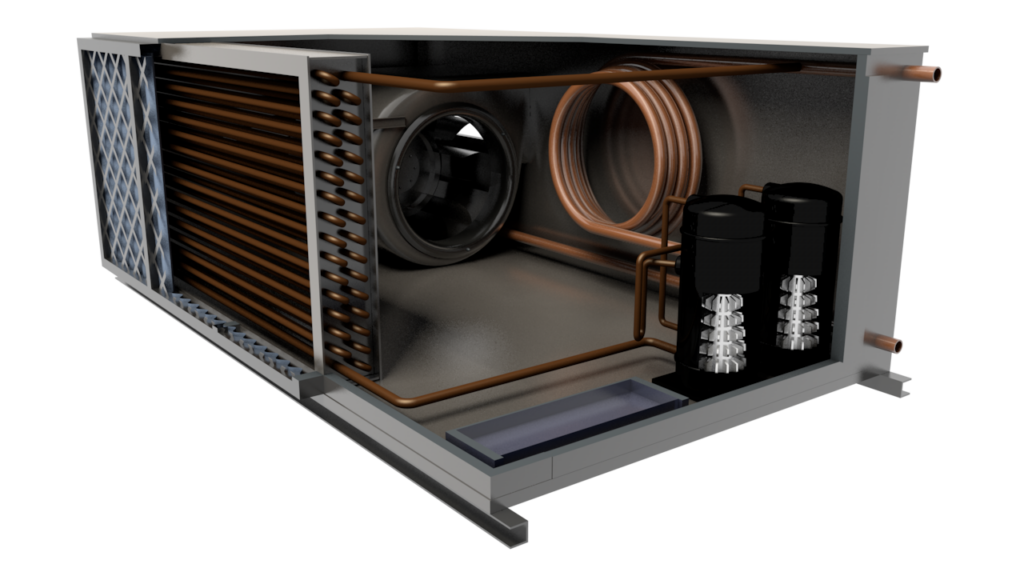
QA Graphics has created a comprehensive library of detailed HVAC equipment for the industry. This library allows customers to use full representations of units or equipment within the BAS UI, complete with animations. Our repertoire also includes detailed 3D equipment flythroughs, exploded views, and videos of interior equipment. Notably, we have produced 3D VR flythroughs of conceptual campuses for the commercial real estate industry.
The Future of BAS Graphics
The evolution of BAS graphics has been propelled by technological advancements, user experience demands, and the need for more efficient building management and automation systems. From basic text-based interfaces to immersive 3D visualizations, BAS graphics have significantly advanced, enhancing building operations and user interactions. QA Graphics is at the forefront of pushing the industry in a graphic technology direction. A prime example is our vector symbol library, one of the most comprehensive on the market, offering the industry a scalable resource for building BAS UI graphics within supportive software. This library ensures that end users can view the graphics on any device, without any degradation in quality, marking it as one of our most successful symbol libraries to date.
Work with QA Graphics
Are you looking to elevate your building automation systems with state-of-the-art graphics? Discover QA Graphics’ extensive library and services to see how we can transform your BAS interface. Contact QA Graphics today to learn more about our solutions and their benefits for your operations.


Leave a Reply