At QA Graphics, our mission has always been clear.
We help system integrators deliver better building automation graphics through experienced in house production services, proven workflows, and a deep understanding of what it takes to execute BAS graphics at a high level.
That continues to be our core focus.
We still believe outsourcing is the best option for many system integrators. It allows control contractors to keep their internal teams focused on engineering, programming, service, commissioning, and customer support while we handle the production work efficiently and consistently.
At the same time, we understand that some integrators choose to perform certain graphics related tasks internally. When that happens, the quality of the tools they use matters.
That is why QA Graphics remains dedicated to developing powerful tools and resources that come directly from the same experience we use in our own production every day.
Built by a Team That Lives in BAS Production
Everything we develop comes from real world use inside our operation. These are not generic software concepts or ideas disconnected from the building automation industry. They are practical solutions shaped by years of experience working with live BAS databases, floor plans, system graphics, navigation structures, and customer expectations across major platforms.
Our team sees firsthand where internal teams struggle. We understand the challenges around consistency, efficiency, usability, and data visualization because we solve those same challenges every day for our customers.
The tools and standards we are rolling out are a direct extension of that work.

Vectortology
Vectortology represents a major step forward in how BAS graphics can be standardized, organized, and improved for long term usability. It is rooted in the idea that high quality system graphics should be more than a collection of symbols. They should follow a structured visual language that supports clarity, consistency, and better operator understanding.
As QA Graphics continues to refine and expand this approach, Vectortology reflects our commitment to creating a smarter foundation for graphics production. It supports the idea that BAS graphics should not only look better, but function better for the people using them.
This is important whether graphics are being outsourced or created internally. A more disciplined and intentional visual system helps everyone.
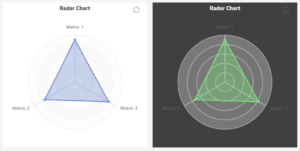
QAG Charts
QAG Charts was developed to give the Niagara community a more powerful way to visualize building data. Standard charting options often fall short when users want dashboards that are more insightful, modern, and useful for operators.
QAG Charts helps bridge that gap by offering advanced chart visualizations designed to present real time and historical data in a clearer and more meaningful way.
For system integrators building dashboards internally, this provides a valuable way to improve the visual layer of the BAS experience. For owners and operators, it creates a better interface for understanding performance, spotting trends, and making informed decisions.
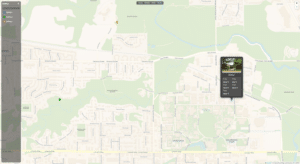
QAG Maps
QAG Maps brings geographic context into the BAS environment. For organizations managing multiple buildings, campuses, or distributed locations, map based visualization can be a valuable enhancement to navigation and system awareness.
This type of tool helps users interact with systems in a way that feels more intuitive and connected to the real world. It is another example of QA Graphics taking practical production concepts and turning them into tools that benefit system integrators and end users alike.
As expectations for BAS user experience continue to grow, tools like QAG Maps help move the industry forward.

QAG Foxhound
QAG Foxhound is another example of QA Graphics building tools from direct production needs. Developed from internal experience, it is designed to help teams work more efficiently when handling data and graphics related tasks within the Niagara ecosystem.
For teams doing graphics work in house, speed and accuracy matter. Tools that reduce manual effort and improve workflow can have a real impact on productivity and consistency. QAG Foxhound reflects that need and turns it into something useful for the broader community.
It is a practical solution built by people who understand where the time goes in BAS production.
Expanding Access Through Our Website
QA Graphics has also launched e-commerce capabilities on our website as part of our continued effort to make our products and services more accessible to the market.
Our plan is to make all of our non graphic outsourcing services available through the site, giving customers an easier way to learn about, purchase, and engage with the tools and resources we offer beyond custom production work.
This is another important step in how QA Graphics is evolving. In addition to providing outsourced graphics, floor plans, and 3D services through our in house team, we are also creating a more direct path for customers to access products developed from our real world BAS production experience.
We Still Believe Outsourcing Is the Best Fit for Many
QA Graphics still believes that outsourcing graphics, floor plans, and 3D content is the right choice for many system integrators.
Producing high quality BAS graphics takes experience, structure, design discipline, and dedicated bandwidth. The same is true for floor plans and 3D content, where consistency, accuracy, and platform knowledge can make a major difference in the final result. Many integrators are better served by partnering with a team that does this work every day rather than pulling valuable internal resources away from core controls work.
That said, we also know the market is diverse. Some teams want to do more internally. When they do, they should have access to better tools, better standards, and solutions built specifically for this industry.
That is where QA Graphics can support the market in more than one way.
More Than a Service Provider
QA Graphics is not just delivering outsourced production services. We are actively investing in the future of BAS graphics through products, standards, and tools that come directly from our own experience in production.
With Vectortology, QAG Charts, QAG Maps, and QAG Foxhound, along with expanded e-commerce capabilities on our website, we are continuing to expand how we support system integrators across the industry.
Some customers will rely on us to handle the work for them. Others will use our tools to strengthen their internal efforts. In both cases, the goal is the same: better graphics, better workflows, and better outcomes for the end user.
QA Graphics remains committed to helping system integrators succeed with practical solutions built by a team that understands the work because we do it every day.