The nominations ballot is now open for the 2015 ControlTrends Awards and QA Graphics is honored to be among the listed candidates for 3rd Party Visualization Software of the Year! The top five or six nominees in each category will be placed on the final voting ballot in December. We are excited to be included in this group and appreciate the support from our friends, colleagues and clients who have recognized us! Help us get on the final ballot by completing the nomination ballot and share this link with your co-workers and colleagues!

Engaging Your Audience with Successful UX & UI Design
As of May 2014, 25% of global web traffic was conducted on mobile devices, this number continues to increase each year. Companies are getting more serious about their business’s mobile presence and need the resources to create responsive designs for online marketing. Responsive design results in nearly 15% increase in unique clicks for mobile users, according the Litmus & MailChimp “The Science of Email Clicks: The Impact of Responsive Design & Inbox Testing” (December 2014). One of the user top complaints is when designs are not mobile friendly. This has lead tech companies focused on creating interfaces for mobile screens and the previously unfamiliar roles of UI and UX Designers.
UX Designers (or User Experience Designers) ensure that designs logically flow from one step to the next and are concerned with exploring different approaches to solving specific user problems. UI Designers (or User Interface Designers) visually communicate the path that the UX designer has laid out. UI Designers deal with the overall feel of the finished product and design each page a user interacts with. Many companies combine these roles because they work so closely together to create engaging experiences for the audience.
Successful UX & UI design incorporates the following:
- Creating a layout that fits the screen.
- Using elements designed for touch screens and ensuring that those elements are the appropriate measurements for touch-ability (44 x 44 points).
- Using text that is at least 11 points so it is easy to read.
- Making sure font colors appropriate contrast with backgrounds.
- Using high resolution images so they don’t appear blurry on retina displays and displaying those images at their intended aspect ratio.
For more details and tips, check out this Do’s & Don’ts article published by Apple Developer.
Not sure where to start? QA Graphics has you covered! Contact us today to find out how our experienced UX/UI Designers can help deliver a uniquely engaging experience for your audience!
How 3D Design is Changing Brand Marketing
3D design is changing the way brands engage with customers through vivid virtual interactions. As customers rely more on online shopping, providing an engaging, true-to-life experience will help brands make a connection with potential buyers.
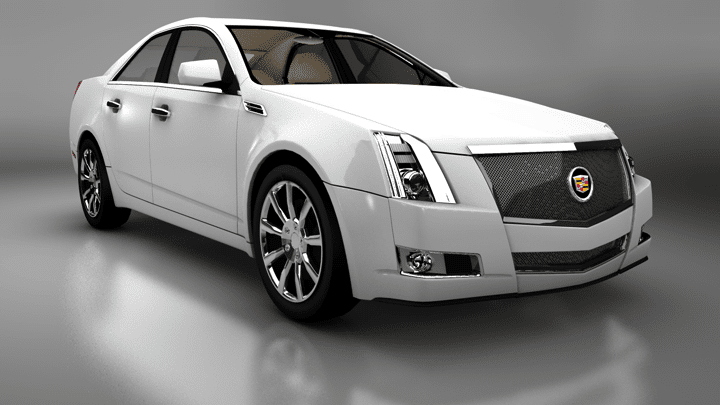
Visualize products in ways that traditional media can’t. 3D design provides more realistic platform for customers to engage with than photography or traditional videography. Today, online shoppers enjoy 360 views of products to examine every aspect before purchasing without having to leave the comfort of their homes. 3D design can take things a step further with walk-throughs of spaces, the ability to place furniture within a space to envision how it would look in your home, and many other interactive experiences for potential customers.
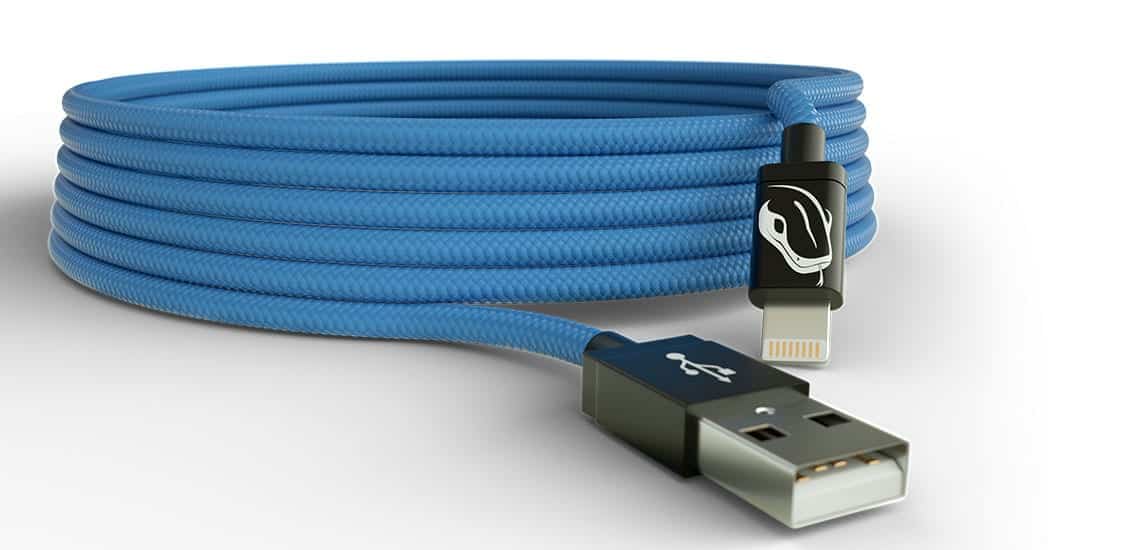
Maintain image consistency and eliminate the need for re-shooting product photos. Once your product is set up using 3D design, you can manipulate the graphics to see any angle or detail. There’s no need to spend time resetting and shooting to get the perfect image to market your product. Quality 3D graphics give your customer a photo-realistic visualization of your products, providing a truly immersive experience. Creating 3D images for catalogs or websites is an appealing and cost effective way to keep your image branding consistent.
Create conceptual designs for new products. Have an idea for a new product but need the funds to get started? With start-up sites like Kickstarter and Fundable, it’s easier than ever to bring your idea from concept to reality, but how do you show your product before you even have one? 3D concepts make it possible to take sketches of ideas and turn them in to life-like product renderings.
Interested in learning about how QA Graphics can help bring your marketing strategy to the next level with 3D design? Contact us today!
Introducing the Latest in Dashboard Technology
As a leader in innovation for energy efficiency, QA Graphics has launched their latest edition of the Energy Efficiency Education Dashboard™ (EEED) powered by The Bridge Data Manager. The new version will use HTML5 technology, allowing for responsive design that adjusts to different devices and lends itself to more mobile options. In addition to these new features, users of the EEED will enjoy all the existing features of the dashboard, including interactive virtual tour capabilities and building performance displays such as Energy Star metrics.
QA Graphics introduced The Bridge Data Manager in 2014, this data logger was designed to seamlessly sync with the EEED, and can also be used as a standalone for controlling data. Bridge’s intuitive, web-based interface makes it easy to use important data. It’s built with HTML5 on Microsoft’s .NET framework and runs as a Windows service. Bridge can be deployed in any network configuration and works with a variety of IT security policies. The data manager connects to all major building automation systems.
“With instability regarding browser support of plug-in technology such as Adobe Flash, we have made the switch to using HTML5 technology to help ensure that our dashboards will be supported in the future,” said Dan McCarty, President of QA Graphics. “We are constantly developing innovative ways to bring additional value to customers through our technology. We believe this shift will allow the Energy Efficiency Education Dashboard to be more user friendly, and combined with the power behind the Bridge Data Manager our customers will have more control than every over their data and reporting.”
Building Sustainable Futures with Energy Management Systems
Sustainability has become a driving factor for governmental regulations as well as for individuals hoping to protect the environment for future generations. Sometimes considered one in the same, Energy Management Systems and Building Automation Systems provide insights into the evaluation of energy and operational data. These systems are the way of the future for building operations across all industries and continue to replace less efficient systems. They give facility managers the ability to analyze data in ways that support more strategic decision making.
Building Automation is often used as an energy management system that efficiently controls air conditioning, lighting and heating comfort systems to help companies and building owners maintain “green” standards. A main benefit of running higher efficiency buildings is lower operating and maintenance costs. This can be accomplished by:
- Using motion sensors for occupancy based scheduling
- Setting software alarms and notifications to alert building managers or technicians of developing problems and system failures before they cause costly problems
- Monitoring and analyzing energy usage to identify trends
- Using control algorithms to reset schedules for heating plants and other systems
To maximize the benefit of Building Automation and Energy Management Systems, facility managers and system integrators can customize their systems with graphics designed specifically for the equipment they use. By using 3D animation, each piece of equipment can be monitored and issues can be indicated with precision, saving valuable time and money when problems arise.
For more information about how these systems can drive sustainability for your company, or to learn more about custom graphics and data management, contact us to talk with one of our knowledgeable team members!